Is this the most important metric to follow for an eCommerce business?
Discover what may be the single most important metric in the eCommerce space that provides an instant snapshot of the health of an eCommerce business.
About the Author:
Co-founder of Datacop, agency that fulfils marketing operation roles in large eCommerce companies such as OluKai, Melin, Roark, Visual Comfort and Company, Dedoles and others.
In today’s article, we’ll discuss a metric that may be the single most important one to monitor as an eCommerce business. This metric captures the combined impact of both your customer acquisition and retention efforts, making it a strong indicator of your business’s overall health. Simply tracking its evolution over time can reveal valuable insights into your company’s performance.
The metric in question is the number of active customers. Typically, we define an active customer as someone who has made a purchase within the last 365 days.
However, if your product is one where customers typically make repeat purchases within a shorter period, such as monthly or quarterly, you can adjust the active window to better match your business model.
Why is this metric so valuable? Because monitoring its trends over time, along with its core components, can tell you a lot about your business’s health. Here’s an example:
Imagine that on January 1, 2024, you have 100,000 active customers—those who made a purchase in the past 365 days. On January 2, that number increases to 100,200, an uptick of 200 active customers. If asked to explain this growth, you might break it down as follows:
New Customers: First, consider the number of new customers acquired on January 1. Let’s say 500 new customers made their first purchase that day.
Reactivated Customers: Next, check for customers who had made their last purchase more than 365 days ago (non-active) but returned to make a new purchase on January 1. Suppose there were 100 such customers.
Churned Customers: Finally, examine the customers on the verge of churning—those whose last purchase was exactly 365 days ago and who needed to make a repeat purchase on January 1 to remain classified as active. Let’s say that out of these, 400 did not make a purchase on January 1 and are therefore classified as non-active the following day.
Using these numbers, we can summarize the relationship as follows:
Active Customers (Tomorrow) = Active Customers (Today) + New Customers (Today) + Reactivated Customers (Today) - Churned Customers (Today)
Applying this to our example for January 1 and 2:
100,200 (Active Customers on 01/02/2024) = 100,000 (Active Customers on 01/01/2024) + 500 (New Customers on 01/01/2024) + 100 (Reactivated Customers on 01/01/2024) - 400 (Churned Customers on 01/01/2024)
Analyzing Business Health
Let’s examine a graph that tracks the number of active customers over time, and see what insights we can draw.
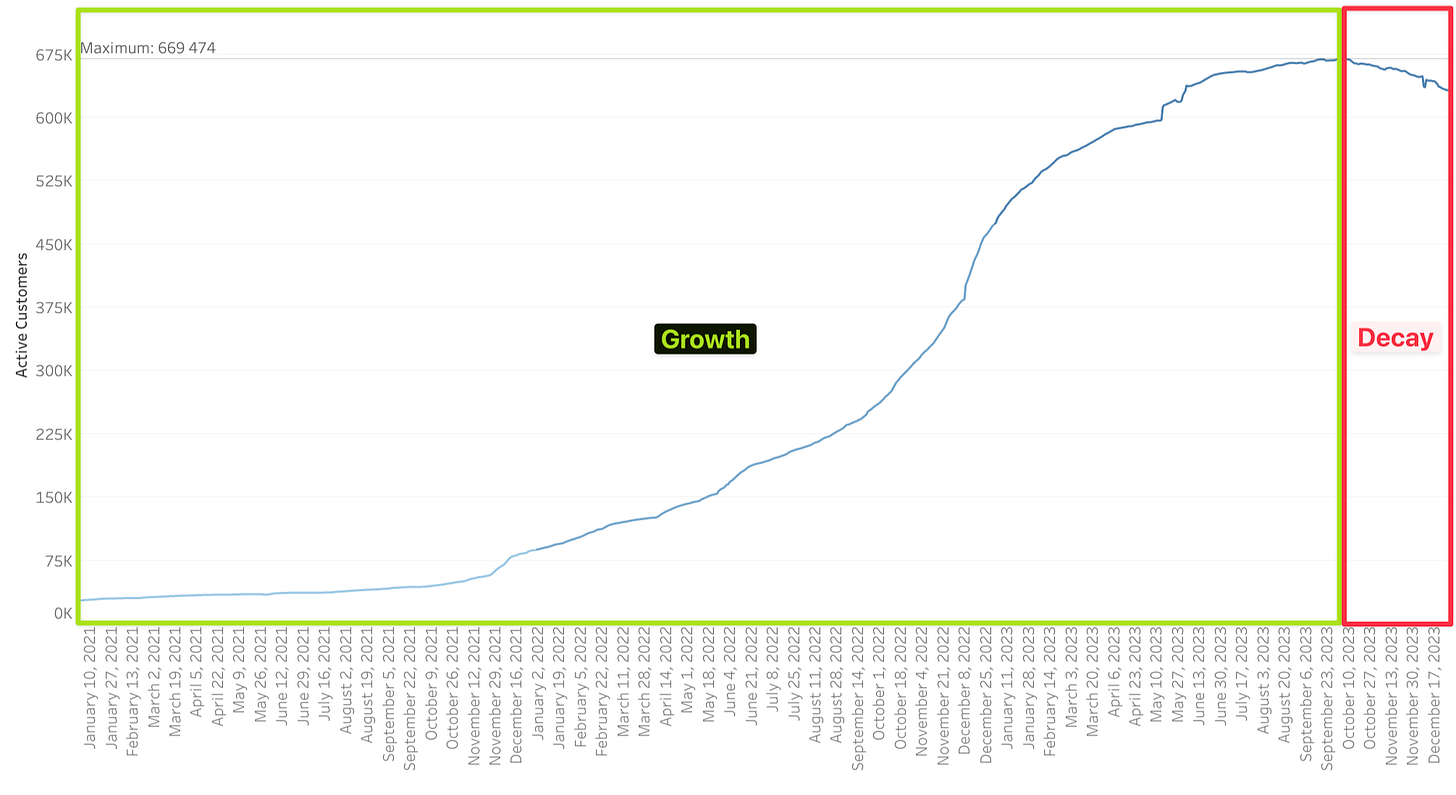
This graph displays the daily count of active customers from January 1, 2021, through the end of 2023. You’ll notice two distinct periods in this business’s growth:
From January 1, 2021, to early October 2023, the business experienced substantial growth. Certain times, like Q4 2022, saw particularly sharp increases in active customers.
During this period, the business consistently acquired and re-engaged more customers than it lost. In other words:
New Customers + Reengaged Customers > Churn
This dynamic resulted in a steady day-to-day increase in active customers.
However, after early October 2023, the trend shifted. The business began losing more customers than it could acquire or reactivate, leading to a decline in active customer count. This means:
New Customers + Reengaged Customers < Churn
This change led to a daily decline in the number of active customers during this period.
As you can see, it’s relatively simple to get a high-level understanding of whether a business is performing well or struggling. This is why we value tracking and reporting the daily number of active customers—it offers a clear snapshot of the overall health of a business.
Active Customer Over Time (Table)
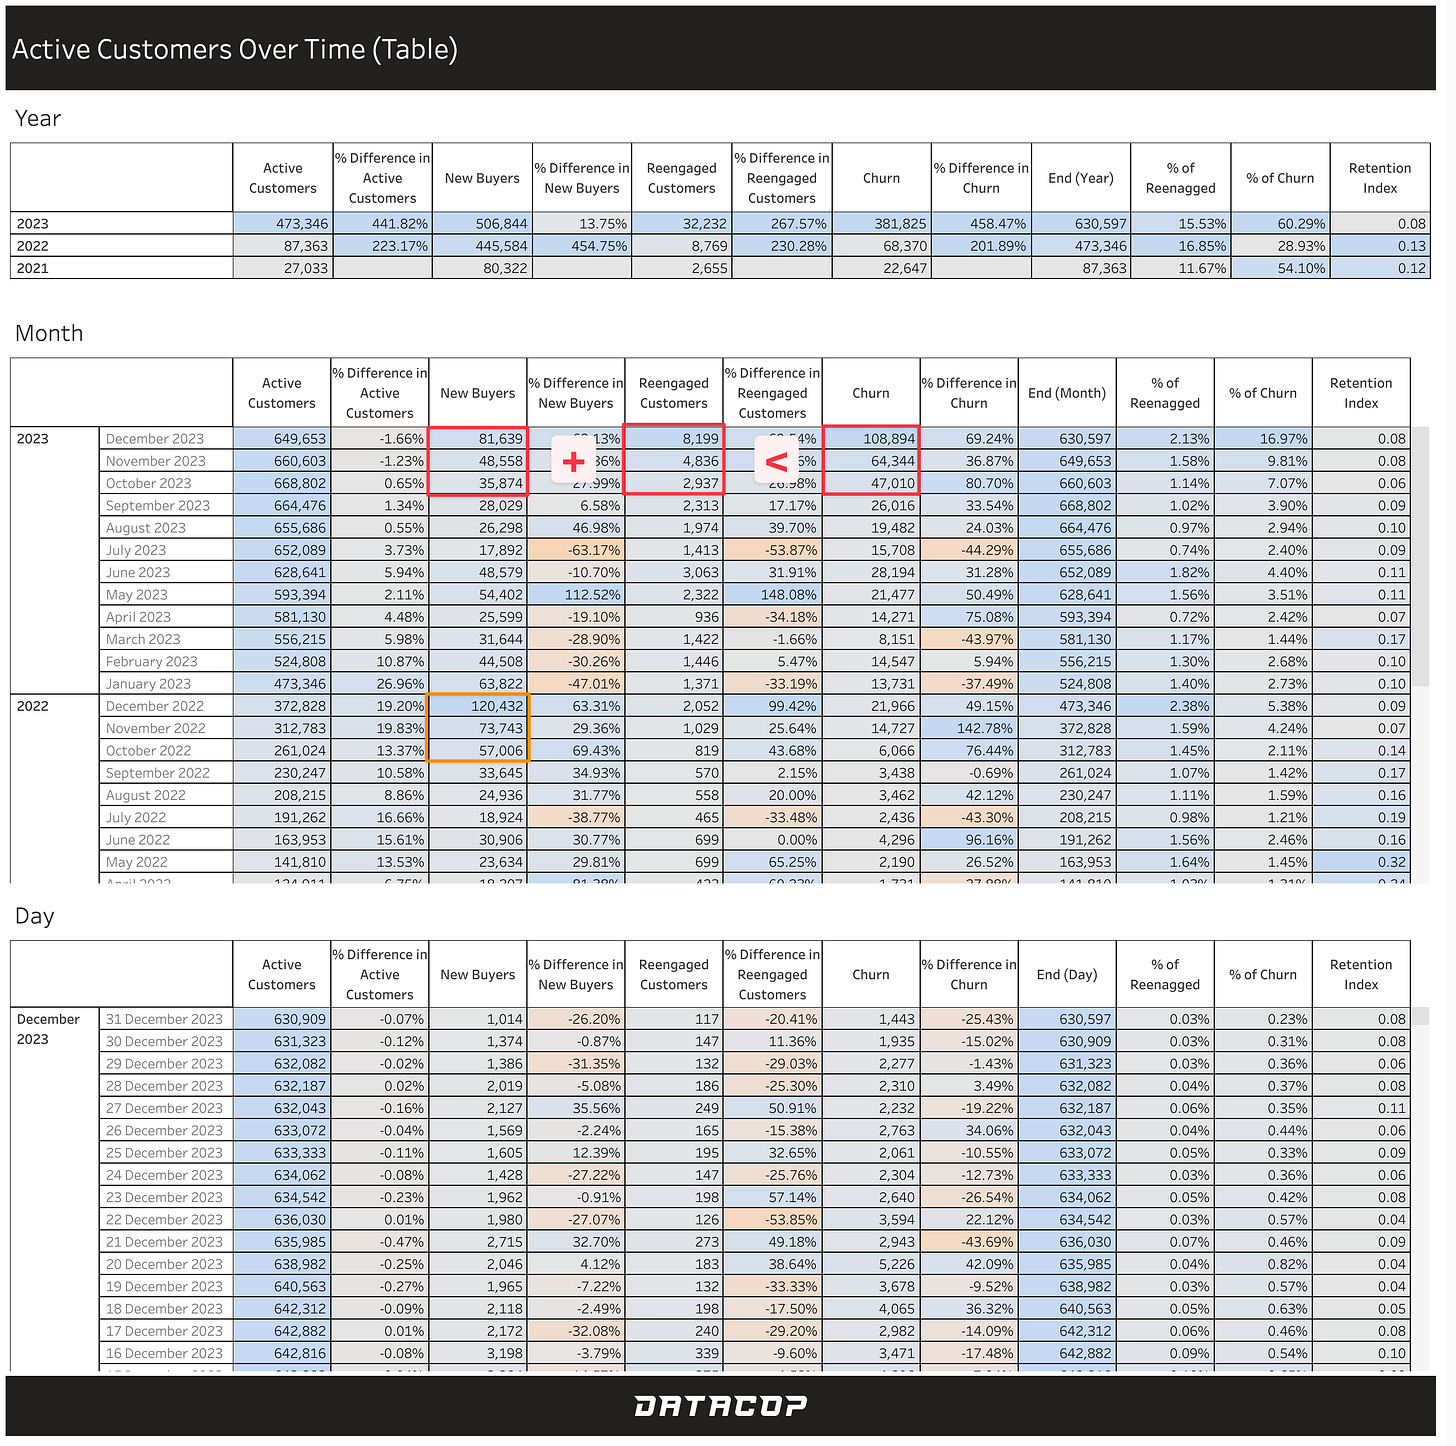
What if we want to dive deeper to understand why the number of active customers is increasing or declining over time? That’s when we turn to this detailed view:
In this view, we have three tables, each reporting the number of active customers across different timeframes.
The first table provides a yearly summary:
The first column shows the number of active customers at the start of each year.
The third column tracks the number of new customers acquired during the year.
The fifth column highlights the number of reengaged customers during the year.
The seventh column records the number of customers who churned.
The ninth column (End (year)) reflects the number of active customers at the end of the year.
The columns between these metrics show the percentage change compared to the previous period. Details on how the last three metrics are calculated will be covered later in the article.
The second table reports the same metrics, but with a monthly granularity.
The third table breaks it down further, offering a daily view.
Now, let’s take a closer look at the last three months of 2023. It’s evident that during this period, we lost more customers than we were able to acquire (new customers) or reengage.
Comparing this to Q4 of 2022, we can see a significant contrast: we were acquiring far more customers during that period than in the same quarter a year later.
So how can we read this data and make conclusions on what want wrong and why business struggled during Q4 of 2023? We believe that are are multiple factors at play that we need to take into account:
New customer acquisition strategy was more efficient in Q4 2022 compared to Q4 2023. Here we would suggest comparing what we did differently during these time periods. What ads did we ran? Did we have sale during both of the periods? Was it the same scale? Did the product offering differ from one period to another? These are highlevel questions that we would ask our selves in order the explain the underperfromance in Q4 2023
High churn during Q4 2023 is a result of an inability to turn new customers from Q4 2022 into repeat customer. When customer makes a purchase, they are considered to be an active customer for the whole consecutive year. If they decide to make a repeat purchase for example 9 months from their original purchase, the clock resents and they will be condiered as active for next 365 days from the point of their second purchase. It is extremely likely that vast majority of customers that churned during Q4 2023 are customers that we acquired in Q4 2022 and we failed to turn vast majority of them into repeat purchasers for the whole consecutive year. This to me is pointing at our retention strategy, which might not be as effective as we might hope for. What we would do in this situation is to review how we approach newly acquired customers and implement changes and use-cases with a goal to maximitze the retention of newly acquired customers.
It’s also possible that the business ran a more aggressive sale during Q4 of 2022 compared to Q4 of 2023. This might mean that many of the customers acquired in Q4 2022 were less valuable and more discount-sensitive than our typical customers. If this is the case, our ability to convert these customers into repeat purchasers may be inherently limited—particularly if we don’t offer similar discounts again.
% of Reengaged, % of Churn and Retention Index
Lastly, let’s take a closer look at the three metrics displayed in the last three columns of each table. We’ll examine them one by one.
% of Reengaged:
On a daily level, this metric represents the percentage of non-active customers reengaged on a specific day. If you hover over any day in the last table, you’ll see a formula with the exact values used to calculate this metric. Let’s consider an example from December 31, 2024:
On this day, we reengaged 117 customers out of a total of 439,719 non-active customers. This translates to reengaging 0.03% of the total non-active customer base on December 31.
To calculate the total % of Reengaged for December 2023, we sum up the daily percentages of reengaged customers for all days in the month. This aggregated value is what’s reported at the monthly level in the % of Reengaged column. It shows the percentage of the non-active customer base that we successfully reengaged during December 2023.
The same calculation applies on a yearly level. For instance, throughout the entire year of 2023, we successfully reengaged 15.53% of the non-active customer base.
The goal of this metric is to maximize the percentage of non-active customers reengaged on any given day, month, or year. It serves as a key indicator of the effectiveness of your retention strategy, particularly in reactivating older customers who made their last purchase more than 365 days ago.
% of Churn:
On a daily level, this metric represents the percentage of active customers lost on a specific day. Similar to the % of Reengaged metric, hovering over any day in the last table reveals the formula with the exact values used for its calculation. Let’s revisit an example from December 31, 2024:
On this day, we lost 1,443 customers out of a total of 630,909 active customers, resulting in a 0.23% loss of the active customer base.
At the monthly level, this metric shows the percentage of the active customer base lost during a particular month, and at the yearly level, it represents the percentage of active customers lost over the entire year.
The goal is to minimize churn as much as possible. Lower churn indicates stronger retention, as it means more customers are making repeat purchases within the 365-day window following their previous purchase, keeping them within the active customer base.
Retention Index:
The Retention Index is calculated as the ratio of reengaged customers to churned customers over a given day, month, or year.
Example: December 31, 2023:
On this day, the Retention Index is notably low because the number of reengaged customers (117) is relatively small compared to the number of churned customers (1,443). This results in a Retention Index of 0.08.
The Retention Index provides insight into the rate at which the number of non-active customers is growing or shrinking. Here’s how to interpret the metric:
Retention Index = 1
This means the number of reengaged customers matches the number of churned customers. In this case, the non-active customer base remains stable, with no growth or decline.Retention Index > 1
A value greater than 1 indicates that more customers were reengaged than lost, leading to a reduction in the non-active customer base over the given time period.Retention Index < 1
A value less than 1 suggests that the non-active customer base is growing because more customers are being lost than reengaged. The closer the Retention Index is to 0, the faster the non-active customer base grows.
We hope this article was valuable to you. If you enjoyed it, don’t miss out on future articles—subscribe for free and have our latest content delivered straight to your inbox.
If you'd like to discuss any aspect of eCommerce marketing operations with us or explore potential collaboration, feel free to schedule a meeting using the link below:


What about MER? POAS?