4 Critical Objects Worth Analyzing in eCommerce (Introduction to Data Analytics)
We identified four main objects in eCommerce that are worth analyzing and monitoring. Discover what these objects are.
About the Author:
Co-founder of Datacop, agency that fulfils marketing operation roles in large eCommerce companies such as OluKai, Melin, Roark, Visual Comfort and Company, Dedoles and others.
Today, we begin our discussion on Data Analytics in eCommerce. In previous articles, we successfully covered best practices for Data Collection, focusing on first-party and zero-party data, as well as email and SMS acquisition.
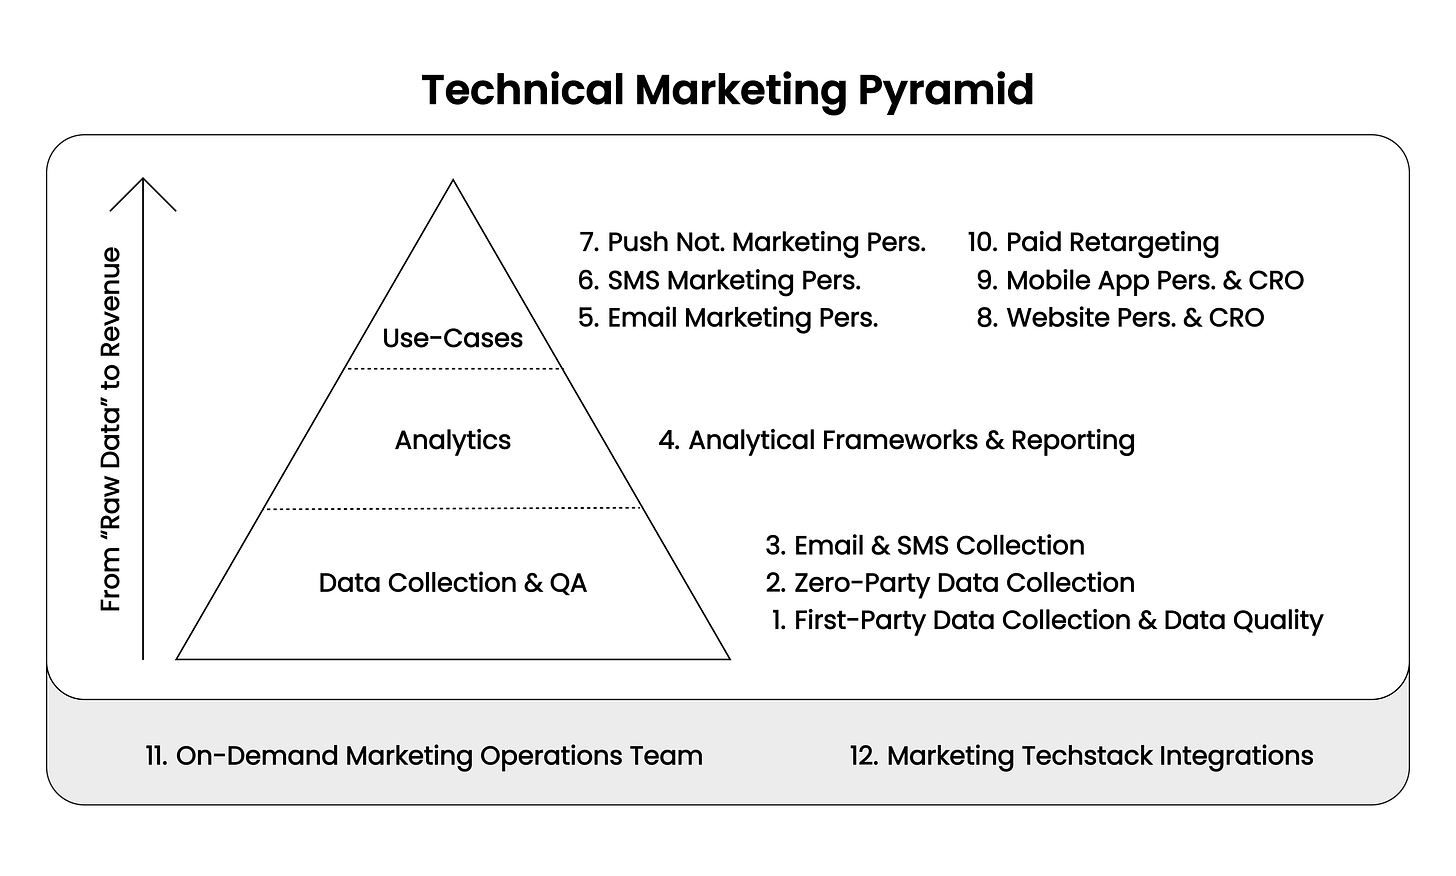
Now, we’ll be exploring the middle layer of the pyramid, which highlights the core areas of expertise within the technical marketing department for eCommerce.
Data Analytics is where we have the most extensive experience. After years of building eCommerce reporting systems for our clients, we believe we’ve developed unique frameworks and best practices that are not readily available elsewhere.
In this article, we’ll provide an overview of Data Analytics in eCommerce, sharing our perspective on its role and defining the most common objects we analyze in the eCommerce space. In future articles, we’ll dive deeper into specific areas of eCommerce Data Analytics.
How We Think About Data Analytics In eCommerce?
We view data analytics as having similar utility and characteristics to vision. Just as vision helps you navigate the world, strong data analytics frameworks and tools enable you to clearly understand what’s happening in your business and identify the factors driving positive or negative outcomes.
We don’t view data analytics as binary—something you either have or don’t have. Instead, the quality of data analytics exists on a continuum.
It's much like vision. The world isn’t divided into those who see perfectly and those who are completely blind. Most people fall somewhere between these extremes. For instance, you might have mild nearsightedness, allowing you to see and understand your surroundings well, but with occasional blurriness. The same concept applies to data analytics. Any eCommerce company exists somewhere on this continuum, ranging from being nearly "blind" to having a crystal-clear understanding of the factors driving positive and negative outcomes in their business.
Of course, we don’t claim to have created the perfect analytical tools or frameworks (which may not even be possible) that can answer every possible question.
Instead, we offer the best approximation of eCommerce reality that we’ve developed up to this point.
It’s also important to emphasize that the quality of data analytics heavily depends on the quality of the underlying data. In today’s world, there are numerous challenges in maintaining high data quality in eCommerce. While there are partial solutions, these issues are difficult—if not impossible—to completely resolve. By definition, data analytics will reflect these limitations. Though it may never be flawless, we should always aim for the most accurate approximation of reality.
What “Objects” Do We Analyze in eCommerce?
Generally, we identify four main objects in eCommerce that are worth analyzing and monitoring. These objects are:
Shop
Products
Customers
Campaigns, which can be further divided into:
Paid Campaigns
Owned Channels
Let’s briefly review each of these objects and define their key characteristics.
Shop
The shop is the digital space where an eCommerce business offers its products for sale. Similar to a brick-and-mortar store, it has a structure or layout that can be optimized for better overall performance. However, unlike physical stores, the layout of an online shop doesn’t have to remain the same for all customer cohorts.
In a physical store, whether you’re visiting for the first time or have shopped there five times, the experience is largely the same. In eCommerce, however, you can offer fundamentally different layouts and experiences to different customer segments. For instance, as discussed in this article, you might design distinct homepages for three specific cohorts:
First-time visitors
Returning visitors
Returning customers
The most widely adopted metric for analyzing shop performance is the conversion rate (the number of purchases divided by the number of visits or sessions). However, it’s often more insightful to monitor revenue per visit as a default metric, as it accounts for some of the limitations of conversion rate.
For example, if you increase your product prices by 10%, you may see a drop in your conversion rate, which could initially seem negative. But if your revenue per visit remains stable or increases, you would likely conclude that the price increase was a beneficial move overall.
We will dedicate a separate article to a tool we developed for analyzing shop performance, called Shop Monitoring. In that article, we’ll dive deeper into the key frameworks and metrics for evaluating shop performance.
Products
Products are the items that eCommerce is selling. Every eCommerce company must make strategic decisions about their products: Which ones should be promoted through paid advertising? Which products should be featured in the next season? And which should be discontinued? Moreover, which products deserve more prominent exposure on the website?
This last question highlights a key difference between eCommerce and brick-and-mortar stores. In a physical store, there is only one set of products that can be displayed in the shop window, which is the most visible space, and the same display is presented to all customers.
However, in eCommerce, this doesn't have to be the case. If I know a customer’s preferences, I can tailor the virtual "shop window" to each individual, offering a personalized shopping experience.
For customers about whom I have no information, I would likely feature products with the highest demand. But how do we determine which products are in the highest demand?
We have written a dedicated article that answers this exact question, which you can find:
In a future article, we will showcase a demo of our product reporting tool, which includes the frameworks described in the article above, along with many other valuable frameworks.
Customers
Customers are individuals who have made at least one purchase from your eCommerce store. A key metric often used to evaluate customer value is the lifetime value (LTV) to customer acquisition cost (CAC) ratio.
Lifetime value (LTV) refers to the total profit a customer generates over the duration of their relationship with your business. We recommend calculating it as the total revenue generated by a customer, minus any refunds and the cost of goods and services. This gives a clearer picture of the actual profit each customer brings to your company.
On the other hand, customer acquisition cost (CAC) measures the average amount spent to acquire a new customer.
For your business to be profitable, LTV must exceed CAC. If the profit from a customer’s first order is higher than the acquisition cost, you're making a profit immediately. If not, your business will depend on customer retention to generate profit over time.
Different customer cohorts may have varying lifetime values. Therefore, robust customer reporting allows you to analyze LTV at a cohort level, helping you identify which customer segments are most valuable to your business, and which ones might require less attention.
We will dive deeper into customer reporting in a future article, where we'll also showcase our solution and key analytical frameworks.
Campaigns
Campaigns refer to paid advertisements or newsletter send-outs, primarily designed to drive customers to your website with the goal of generating purchases.
We divide campaigns into two broad categories:
Paid Campaigns (PPC): These are campaigns that run on platforms like Facebook, Google, or TikTok.
Owned Channel Campaigns: These typically include email or SMS newsletters, but for some brands, they may also involve channels like mobile push notifications.
For paid campaigns, the primary metric we evaluate is Return on Ad Spend (ROAS). For owned channels, we focus on Revenue per Email (or SMS/Push notification).
We’ve also developed a distinct set of reports specifically for Owned Channel Subscribers. The key metric we monitor here is the average subscriber value after they join email, SMS, or push notification lists.
There are several other important frameworks related to email subscribers, such as email health segmentation and the percentage of subscribers who become buyers. We'll explore these frameworks in more detail in a future article.
That concludes today's article, which provided an overview of the data analytics landscape in eCommerce and identified four main categories that are important for every eCommerce company to analyze.
If you found this post valuable…
We hope you found this article valuable. If so, please consider subscribing (for free!) to receive updates on our latest publications.
If you'd like to explore any topics mentioned in the article further, or if there's anything else we can assist you with, feel free to schedule a meeting with us by clicking the button below:


