Understand Your Email Campaign Performance as Never Before
Explore the most essential frameworks and visualizations we use to analyze email campaign performance.
About the Author:
Co-founder of Datacop, agency that fulfils marketing operation roles in large eCommerce companies such as OluKai, Melin, Roark, Visual Comfort and Company, Dedoles and others.
Recently, we outlined how we evaluate the performance of email subscribers. This article will focus on our techniques for assessing the performance of what we send to these subscribers— our email campaigns.
We’ll introduce the most important report we use, explaining its key features, when we use it, and how it can be beneficial in different scenarios.
We'll begin by showcasing the report we use to analyze specific campaign performance, followed by reports that provide insight into the overall performance of our email marketing over time.
1. Email Campaigns Evaluation
In this section, I’d like to give you a quick video demo of the exact report we’ve built to evaluate the performance of specific campaigns, showcasing two unique features that I believe you won’t find elsewhere. Before continuing, I highly encourage you to watch the following video, as it provides essential context for everything that follows in this article.
One key feature of this report is the ability to break down each campaign's performance by different subscriber segments. For instance, if you click on a specific campaign in the first table…
…you can break down this campaign's KPIs by various subscriber cohorts. For example, here’s a breakdown by customer LTV:
As you can see, over 50% of this campaign's revenue was generated by the highest LTV customer cohort, even though they represent only about 21% of all recipients.
f we break down performance by email health segmentation (in other words, subscriber engagement), you’ll see that the best-performing cohort is, perhaps unsurprisingly, the “Active” group. You can read more about how we define email health segmentation in this article.
Other useful ways to break down subscriber performance for a single campaign include:
Last Customer Purchase Cohort
Last Customer Website Visit Cohort
Last Customer Email Subscription Date
and SMS Subscription Status
Of course, you may want to break down campaign performance by different customer cohorts, such as B2B versus B2C subscribers or zero-party data segments. For example, if you’re selling furniture, you might compare the performance of customers living in houses versus those in two-bedroom apartments. These segments can certainly be included in our reporting. However, in this article, we presented subscriber segment cohorts common to all eCommerce companies, which we find particularly useful.
Additionally, when you select a specific campaign in the first table…
You can also track how subscribers who clicked on the campaign engaged with your website in their subsequent session. A funnel visualization is available, showing the number of subscribers who visited the website, viewed a product, added a product to their cart, and ultimately made a purchase:
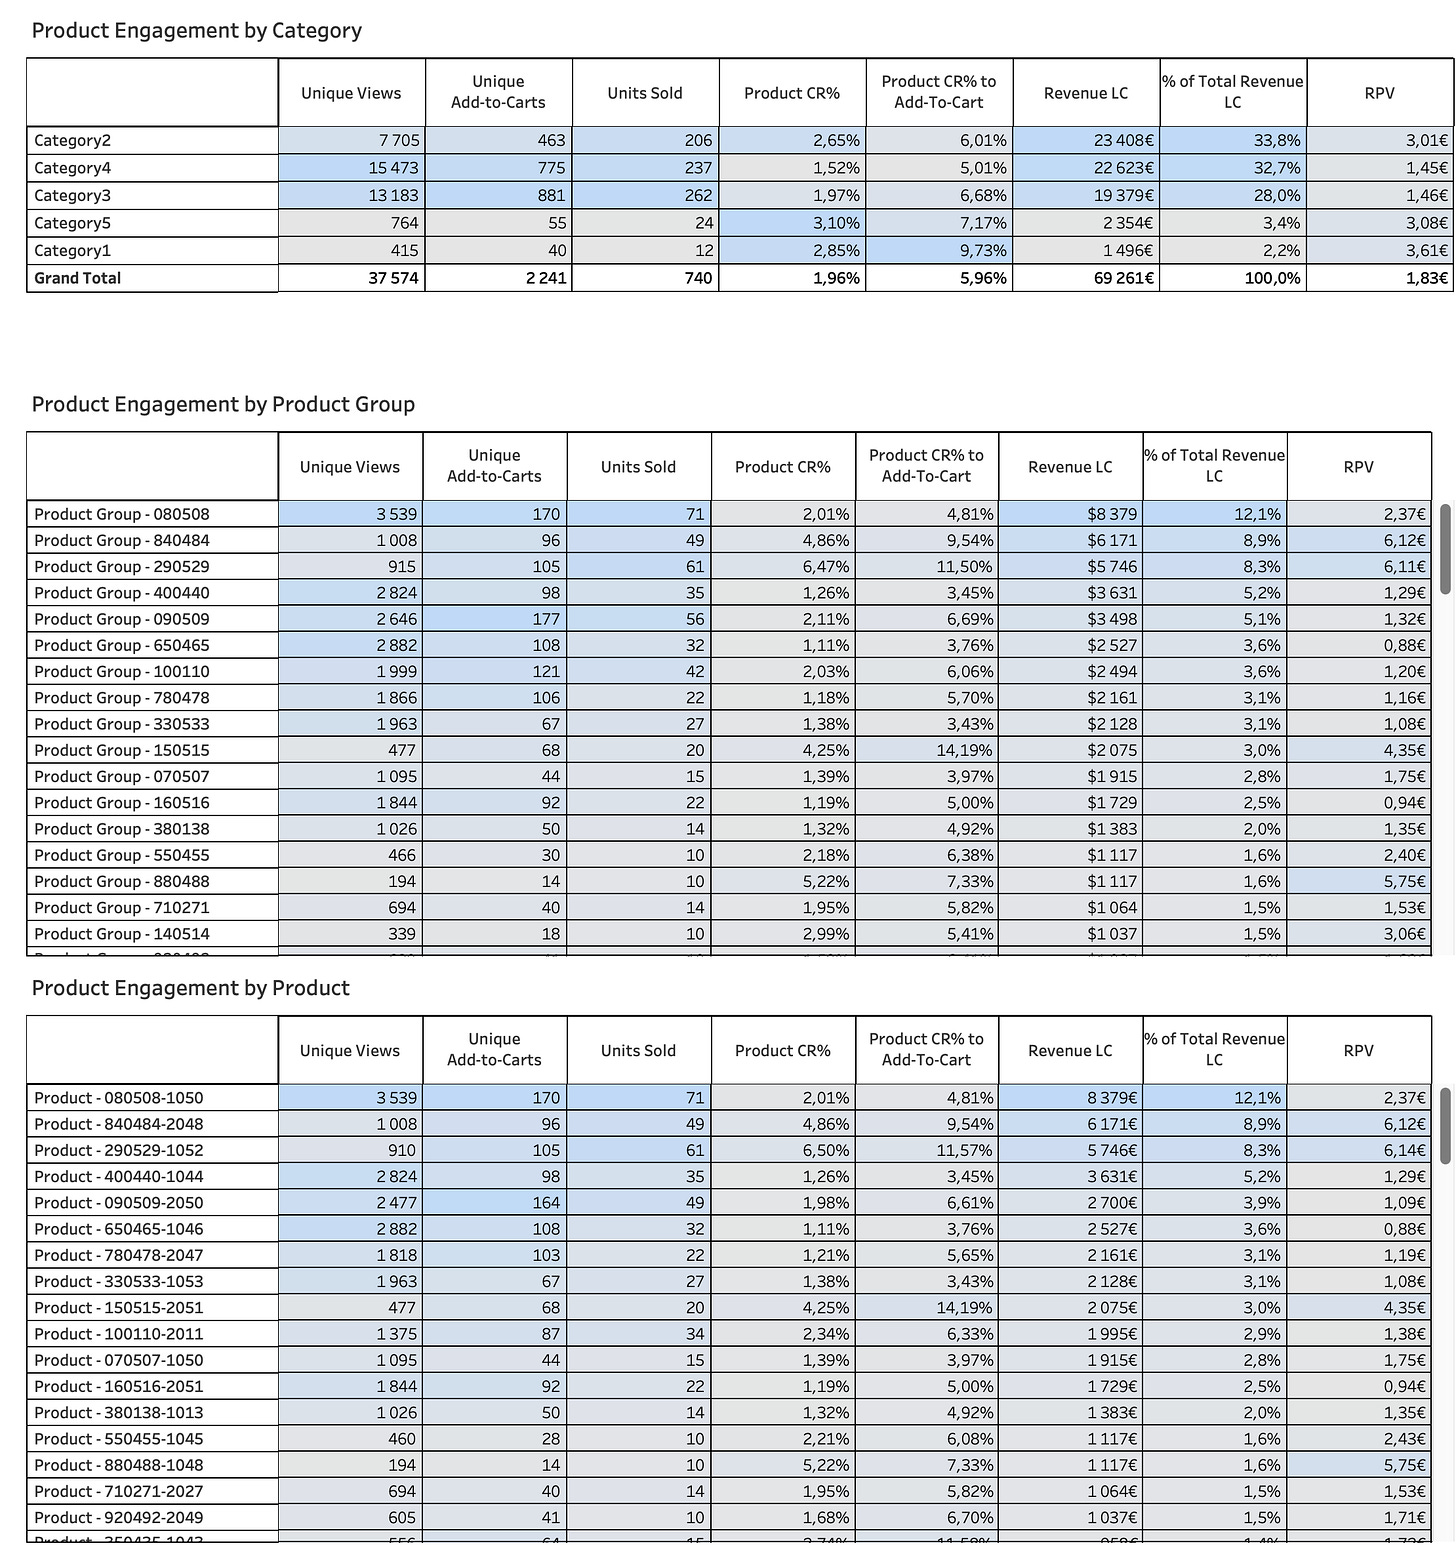
You can also see which product categories, product groups, and specific products these subscribers engaged with.
This feature is particularly useful if you’re promoting multiple products within a campaign and want to understand which ones received the most engagement and which performed best in sales as a result of the email campaign.
2. Email KPI Comparison
This report doesn’t focus on the performance of individual email campaigns; instead, it allows you to evaluate the overall performance of the email channel against any past time period. If you’ve read our article on evaluating email subscriber performance, you’ll find this visualization quite familiar.
This report allows you to compare the cumulative performance of email campaigns for March 2024 (as specified in the right column) against performance from 364 days prior (also defined in the settings in the right column).
The first column shows KPIs for the current period (March 2024), the second column provides performance data from 364 days earlier (March 3, 2023 - April 2, 2023). The third column represents the absolute difference in KPIs between these periods, while the fourth column shows the difference in percentage terms.
You can easily adjust the time period you want to analyze (by modifying the 'Date From' and 'Date To' parameters), as well as the comparison period, by modifying the 'Days Before' parameter.
Additionally, the report is divided into two sections: the top section displays KPIs for email newsletters, while the bottom section shows performance metrics for triggered campaigns, such as cart abandonment and browse abandonment.
Looking at newsletter performance, we can see that revenue generated by campaigns sent in March 2024 is 3.06% higher than last year, despite a 7.05% decrease in total recipients which resulted in an increase of Revenue per Email by 10.89%.
An initial assumption from this observation might be that our email campaigns were more relevant to subscribers, given that we achieved higher revenue with a smaller recipient base.
However, as we'll explore in the next section, this is likely not the primary factor driving the improved performance of this year's campaigns.
3. Double-clicking on each KPI
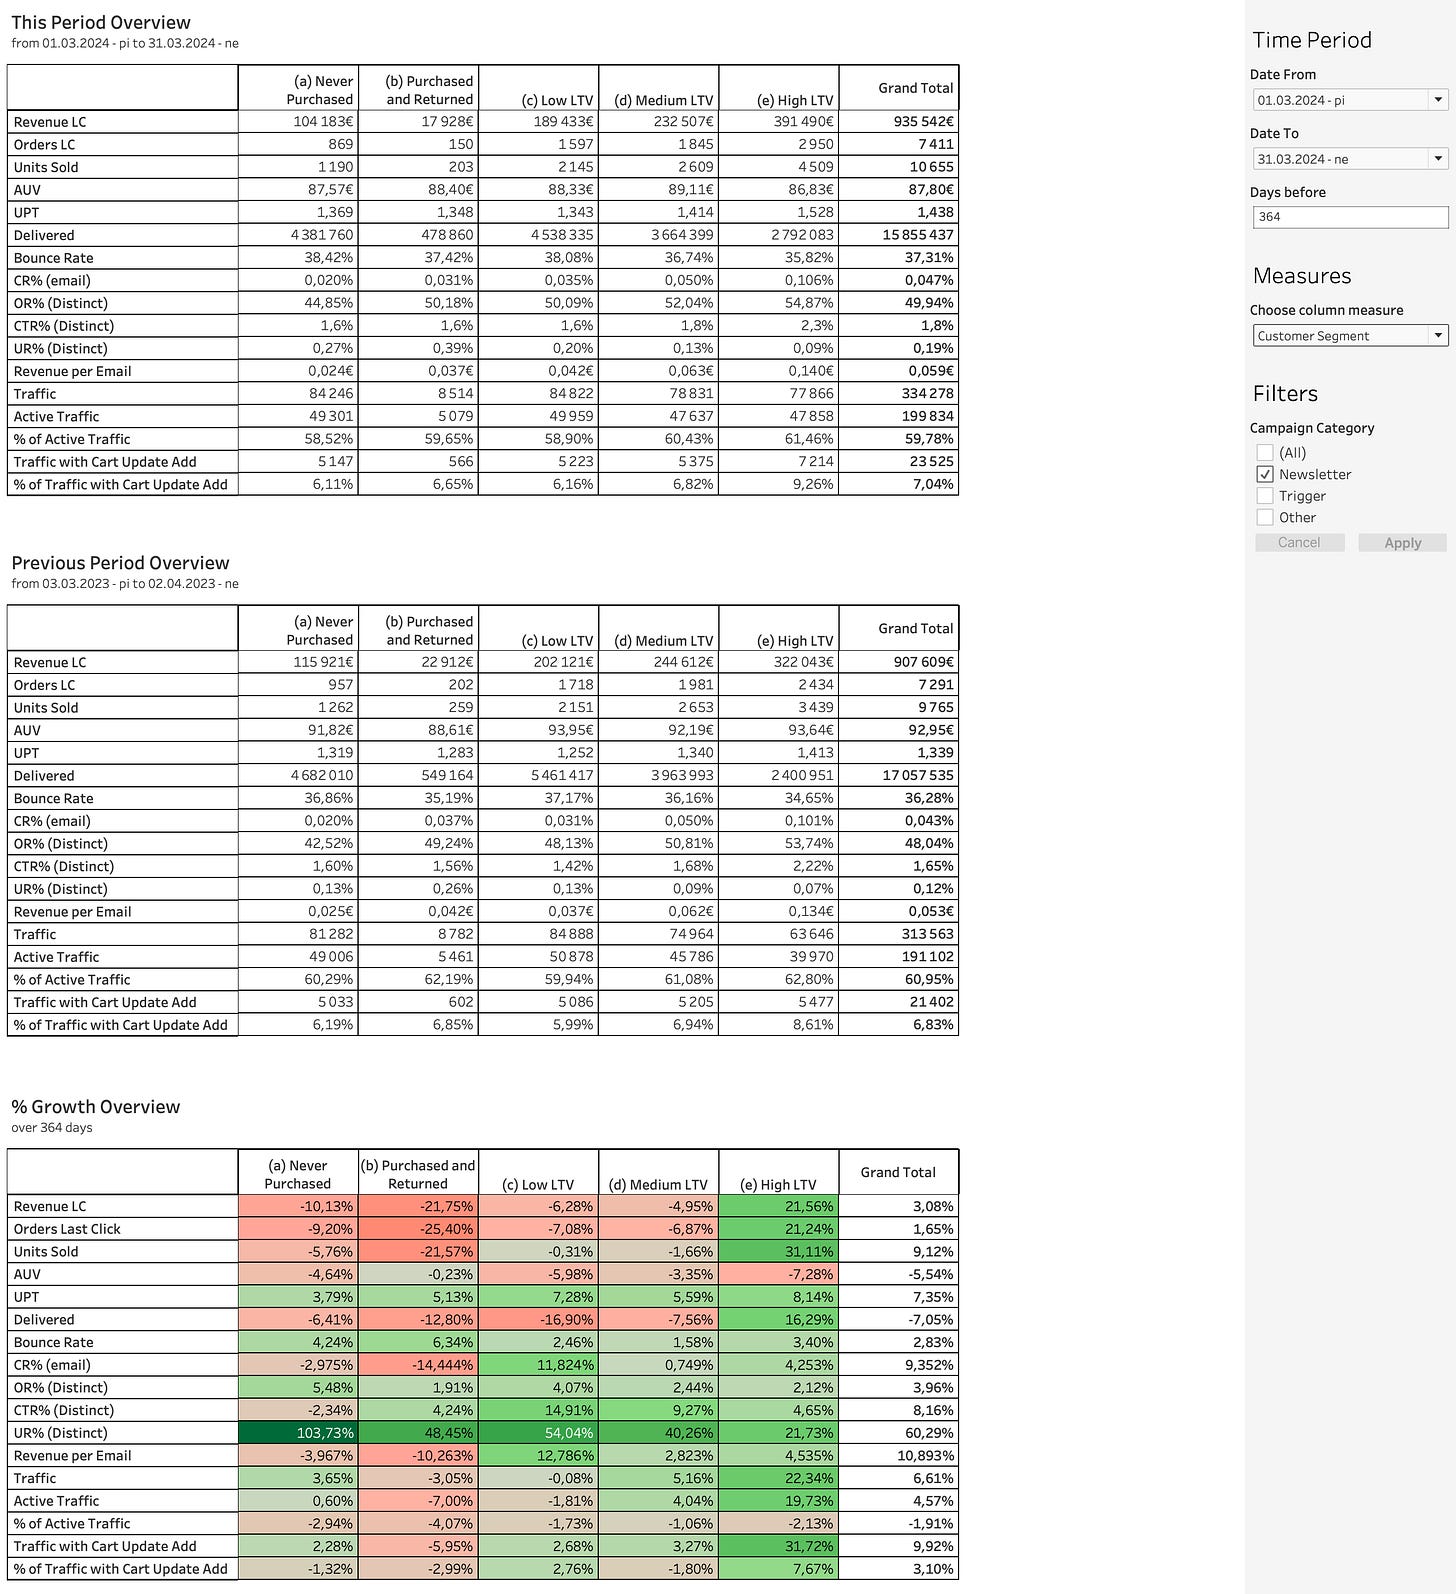
Suppose we want to take a closer look at the improved revenue from our newsletter campaigns, even with a reduced recipient count. What’s driving this positive trend? This is where this view becomes particularly useful:
In this view, each KPI can be broken down by different subscriber cohorts. Currently, we’ve chosen the breakdown by customer segment, though this can be adjusted in the settings on the right.
The first table provides results for the selected period, the second for the previous period, and the third shows the percentage difference for each segment across these timeframes.
There are a few noteworthy observations here:
Revenue per Email: The High LTV cohort has the highest revenue per email sent (for a selected period), at €0.140 per email compared to €0.063 for the Medium LTV cohort. This trend holds for both the current period (€0.140 vs. €0.063) and the previous period (€0.134 vs. €0.062).
Year-over-Year Trends: Revenue and the number of delivered emails have decreased year-over-year for the first four cohorts, with the High LTV cohort as the only segment showing year-over-year improvement.
This shift—sending more emails to the highest-performing cohort and fewer to other cohorts compared to last year—explains the overall improved performance of our email campaigns. Simply increasing the proportion of emails to the best-converting subscribers has enhanced our overall results this year compared to last.
So in this case, if our intuition suggested that this year’s improved email performance is due to more relevant newsletters, we’d be mistaken. In fact, there are similarly counterintuitive reasons why website conversion rates may fluctuate. We dedicated an article to this topic, which you can read here:
4. Analyzing Long-term Trends
The reports we've discussed so far are ideal for analyzing the performance of specific campaigns or comparing results across two distinct time periods. However, neither of these reports is designed to capture long-term trends. That’s why we developed a reporting view that examines each metric across the entire year, comparing it to last year’s performance.
Below are sample charts showing Revenue, Total Number of Recipients from all campaigns, and Revenue per Email, displayed with weekly granularity. This can easily be adjusted to monthly or daily granularity as needed.
We also have the option to analyze trends for specific subscriber cohorts. For instance, we can filter these metrics to focus only on High LTV email subscribers, recent subscribers from the past month, or those who are also subscribed to the SMS channel.
These filtering options provide valuable insights into what’s driving positive or negative trends within each metric.
If you found this post valuable…
We hope you found this article valuable. If so, please consider subscribing (for free!) to receive updates on our latest publications.
If you'd like to explore any topics mentioned in the article further, or if there's anything else we can assist you with, feel free to schedule a meeting with us by clicking the button below:


