

The Datacop Framework for Evaluating Triggered Email Performance
A structured approach to uncover every lever that impacts triggered campaigns—and how to improve performance at each stage.

In today’s article, we would like to take a deeper look at one of the frameworks we also introduced during one of our webinars.
This framework focuses on email trigger evaluation. From our experience, when brands assess the performance of triggered email campaigns, they often concentrate on just one area: what happens once someone sees the email. The main question tends to be, “How do I make the email attractive enough for a subscriber to engage?”
While this is an important consideration, it is only one part of the story. There are several other factors—often overlooked—that have a significant impact on the overall performance of triggered email campaigns.
In this article, we will explore these factors by introducing a framework we call the Triggered Performance Funnel.
Triggered Performance Funnel
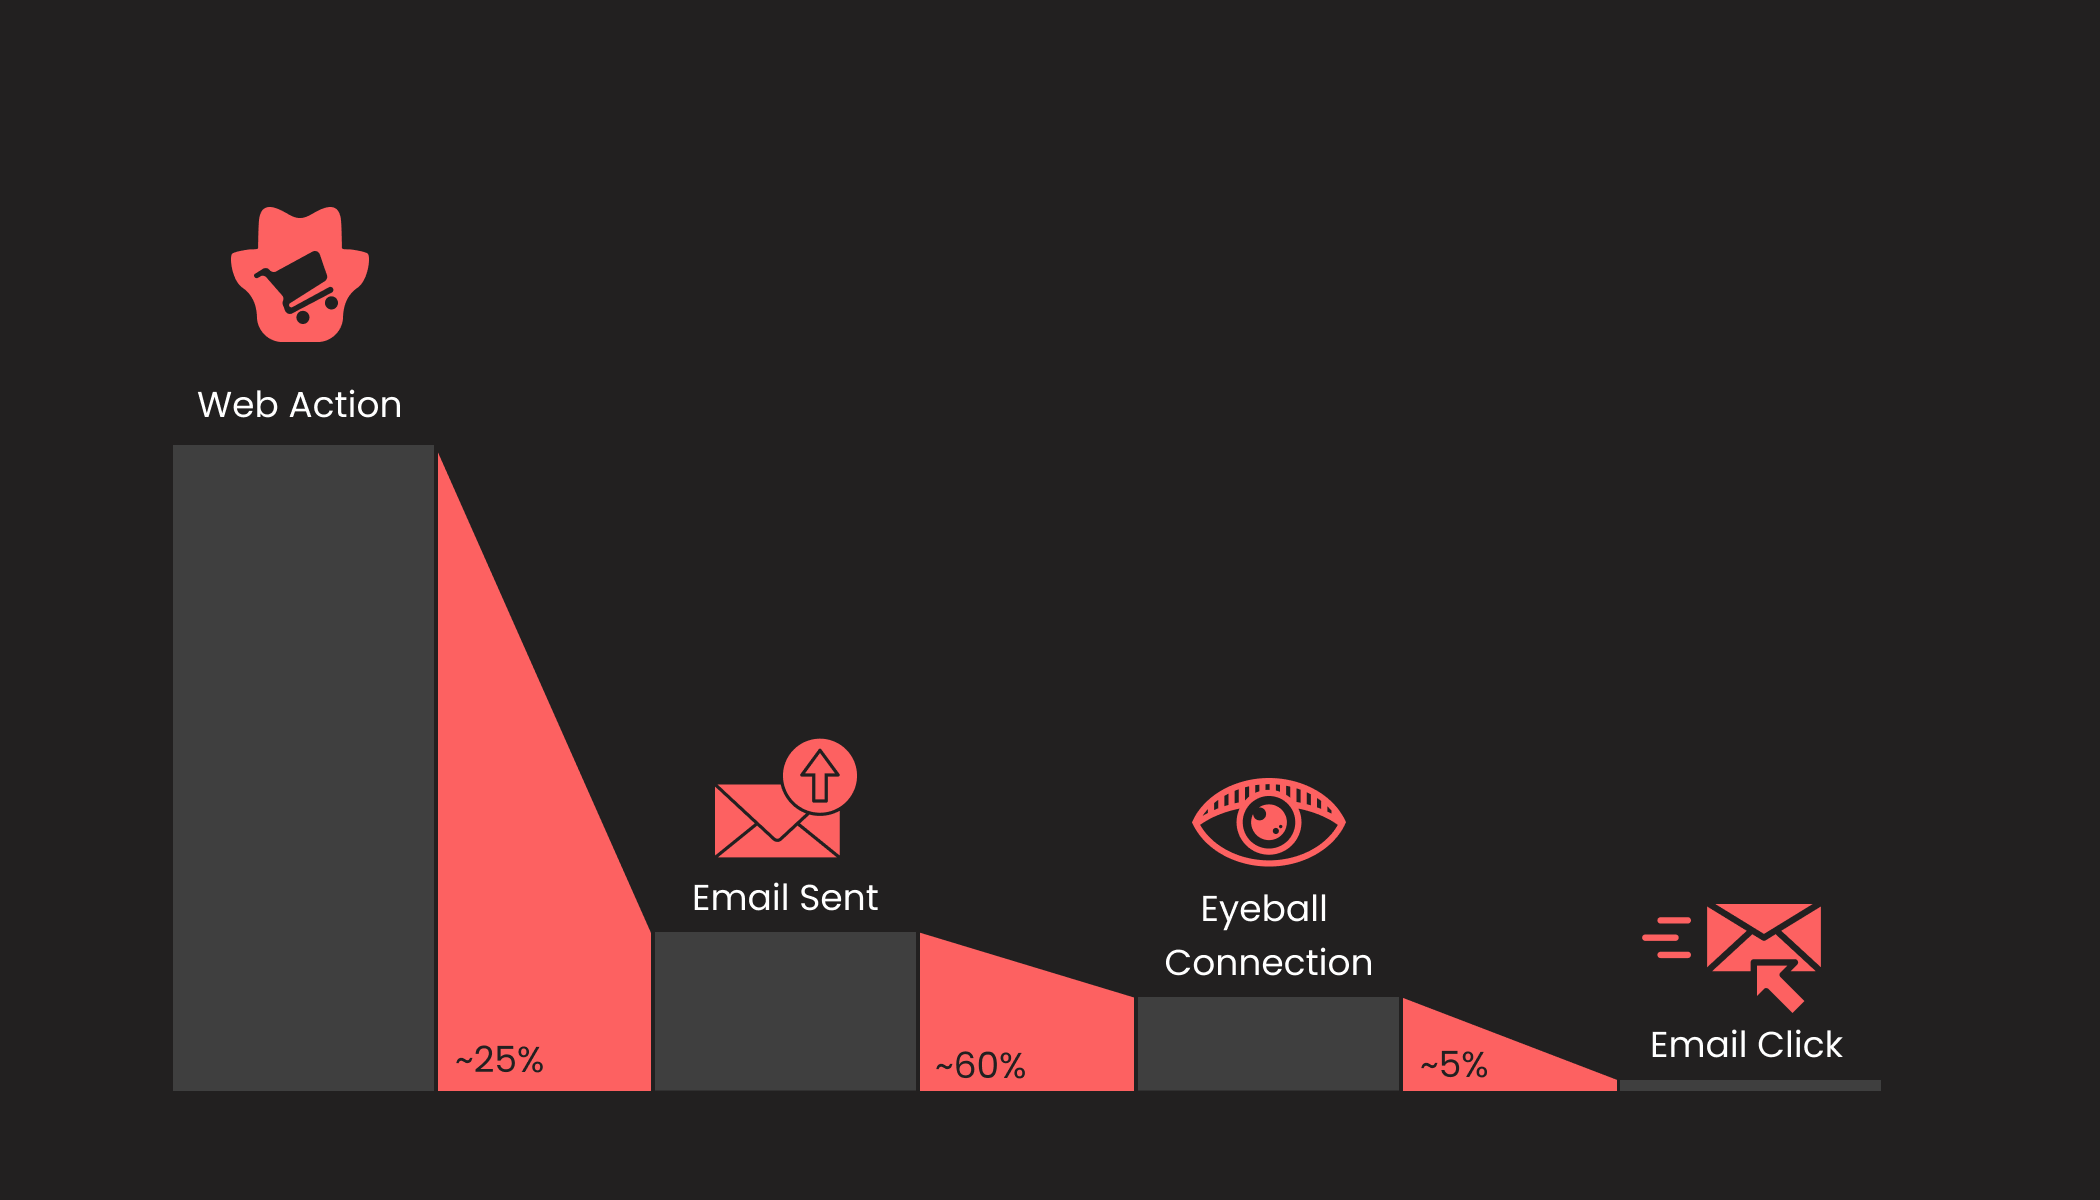
When you want to improve the performance of your triggered email campaigns, it’s helpful to think in terms of multiple touchpoints—or steps—that significantly influence overall results. These steps can be organized into a funnel.
By increasing the number of subscribers who successfully move from one step to the next at any point in the funnel, you can meaningfully improve the performance of the entire campaign.
Let’s take a closer look at the funnel itself and explore what each step represents, as well as how we can influence the metrics at each stage.
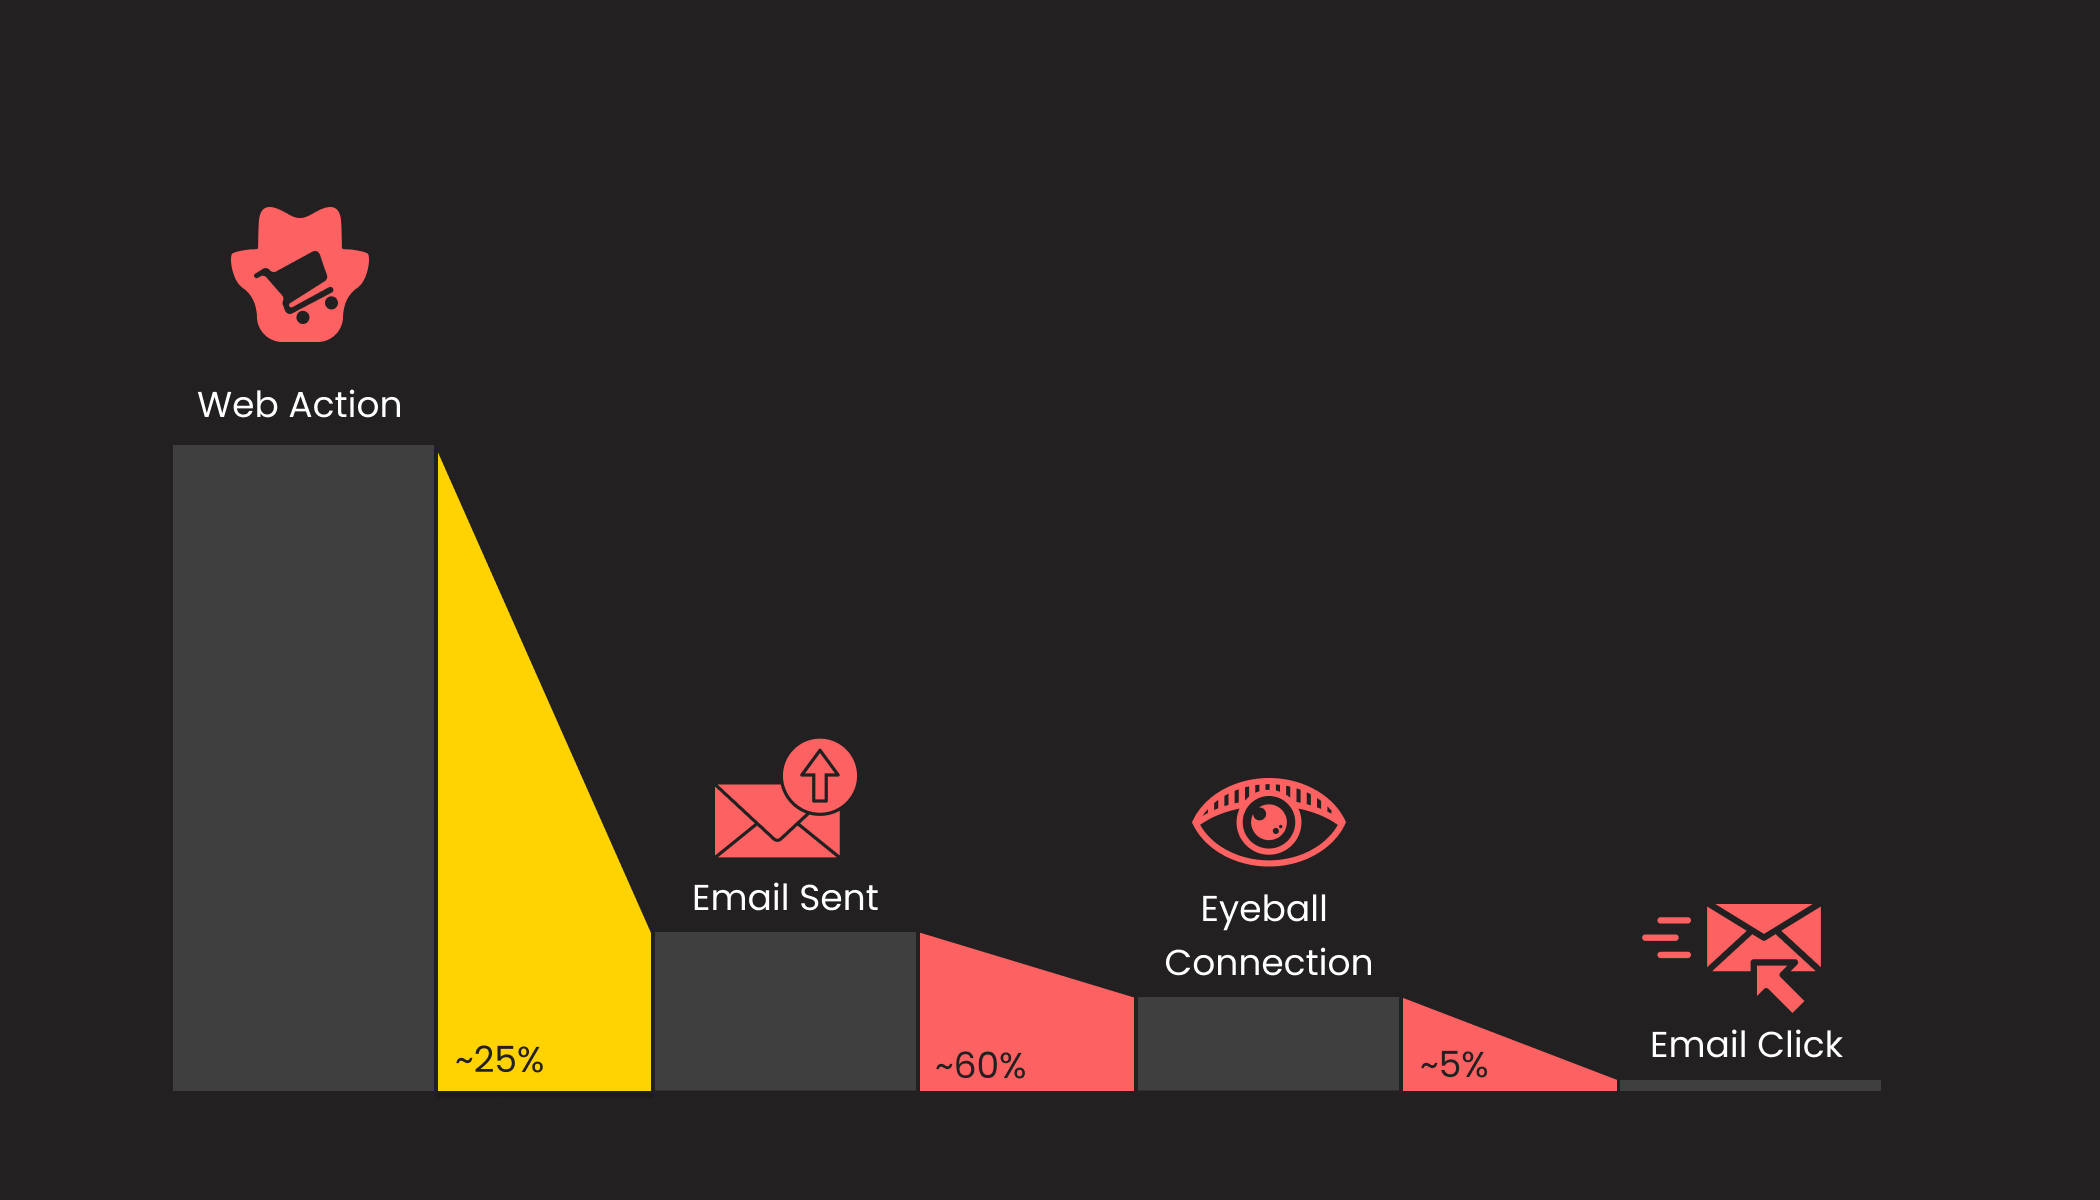
Step 1: From Web Action to Email Sent
Out of all cart abandoners, how many can actually receive a cart abandonment email campaign?
Let’s use a cart abandonment email as an example. In order to send a cart abandonment email, a visitor must first abandon a product in their cart. In theory, this action makes them eligible to receive a triggered email.
However, the critical question is this:
out of 1,000 website visitors who abandon an item in their cart, how many can you actually identify by an email address that has valid consent to receive marketing communications?
Suppose you are able to identify 100 of those 1,000 cart abandoners by email. This means you can retarget only 10% of all cart abandoners. Simply doubling this identification rate would also double the number of emails sent—and, in most cases, double the revenue generated by this campaign.
The key metric to focus on at this stage is the Identification Rate, which can be defined as:
Identification Rate = Number of subscribers entering the cart abandonment flow ÷ Total number of cart abandoners
While this may sound obvious, many brands overlook this step entirely. In practice, we’ve seen identification rates vary dramatically—from as low as 2% to as high as 40%. That difference alone can result in up to a 20× gap in cart abandonment revenue between brands.
The important question now is: what practical steps can you take to increase your identification rate?
This is largely a matter of how robust the digital identity of your website visitors is. We explored this topic in depth in a separate article dedicated to digital identity.

All of the use cases outlined in that article can help strengthen digital identity. However, we would especially highlight cookie lifetime extension, Retention.com, and semi-gated experiences as the most impactful approaches.
Step 2: From Email Sent to Eyeball Connection
Once the email is sent, how likely is it that the subscriber will actually see it?
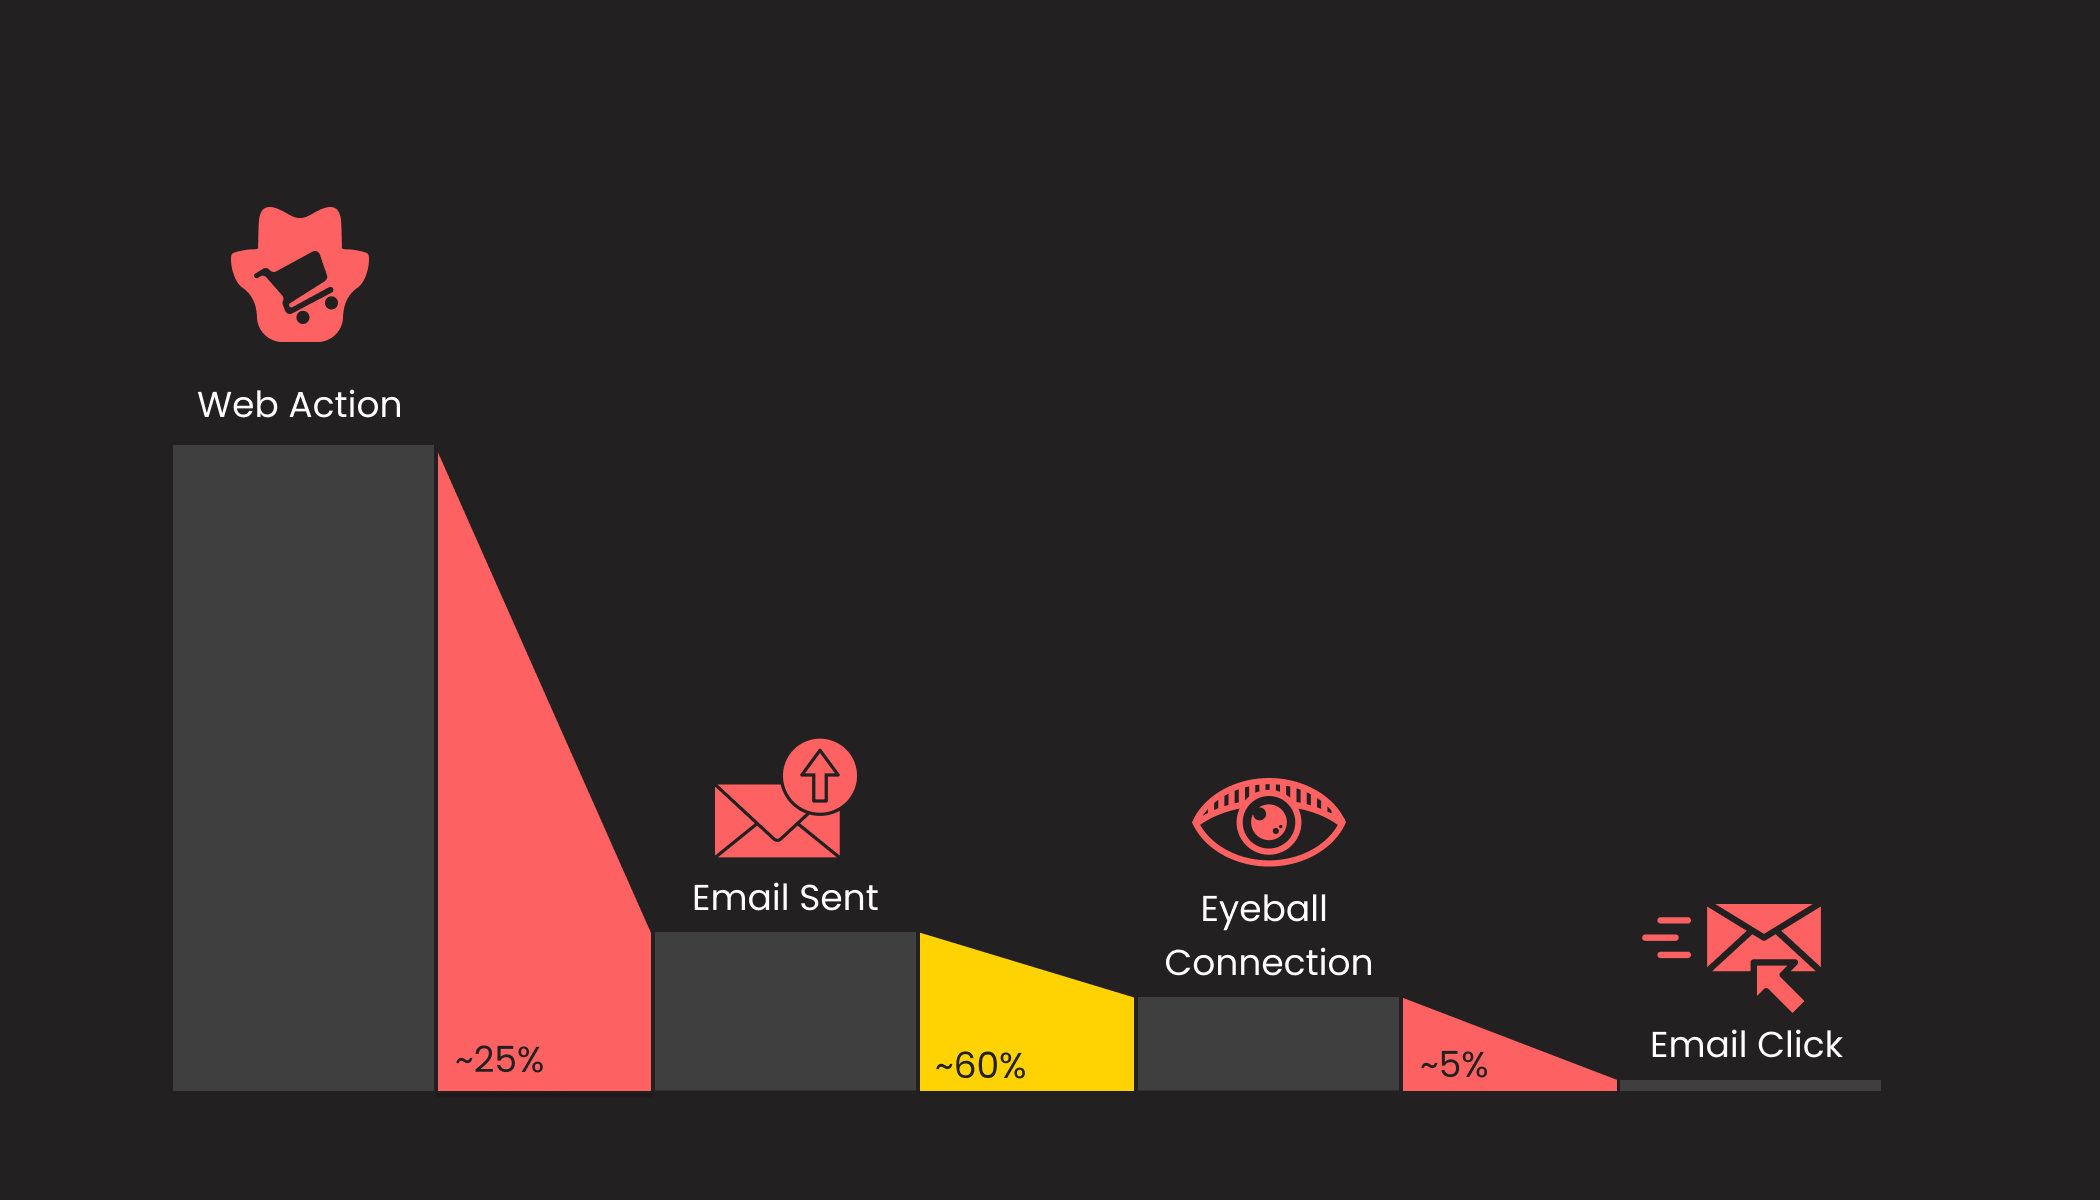
This stage focuses on how many people who receive your email actually notice it—what we call an eyeball connection.
In simple terms, it’s about increasing the chances that a subscriber becomes aware that your email has landed in their inbox.
There are several levers you can pull to maximize the chances of your email being noticed. The most important factor, however, is inbox placement. If your email ends up in the spam or promotions folder, the likelihood of it being seen is significantly lower than if it lands in the primary inbox.
There are tools specifically designed to improve inbox placement. One such tool is Mailmend.io.
At a minimum, however, we strongly recommend monitoring your domain’s email health using tools such as Google Postmaster Tools.
Another effective strategy is testing different send times and aligning them with the times when individual subscribers are most likely to engage with emails.
Finally, testing different subject lines is highly recommended, as this directly increases the chances of creating an “eyeball connection.”
Measuring the Eyeball Connection
The “eyeball connection” cannot be measured directly, so we rely on a proxy metric. Our assumption is that if a subscriber regularly engages with emails, they are noticing them.
To measure this, we create an Email Health segmentation and calculate the ratio of “New” and “Active” subscribers divided by the total number of subscribers who received the campaign.
Eyeball Connection Rate = (New + Active subscribers) ÷ Total recipients
A healthy benchmark for triggered email campaigns is around 60%.
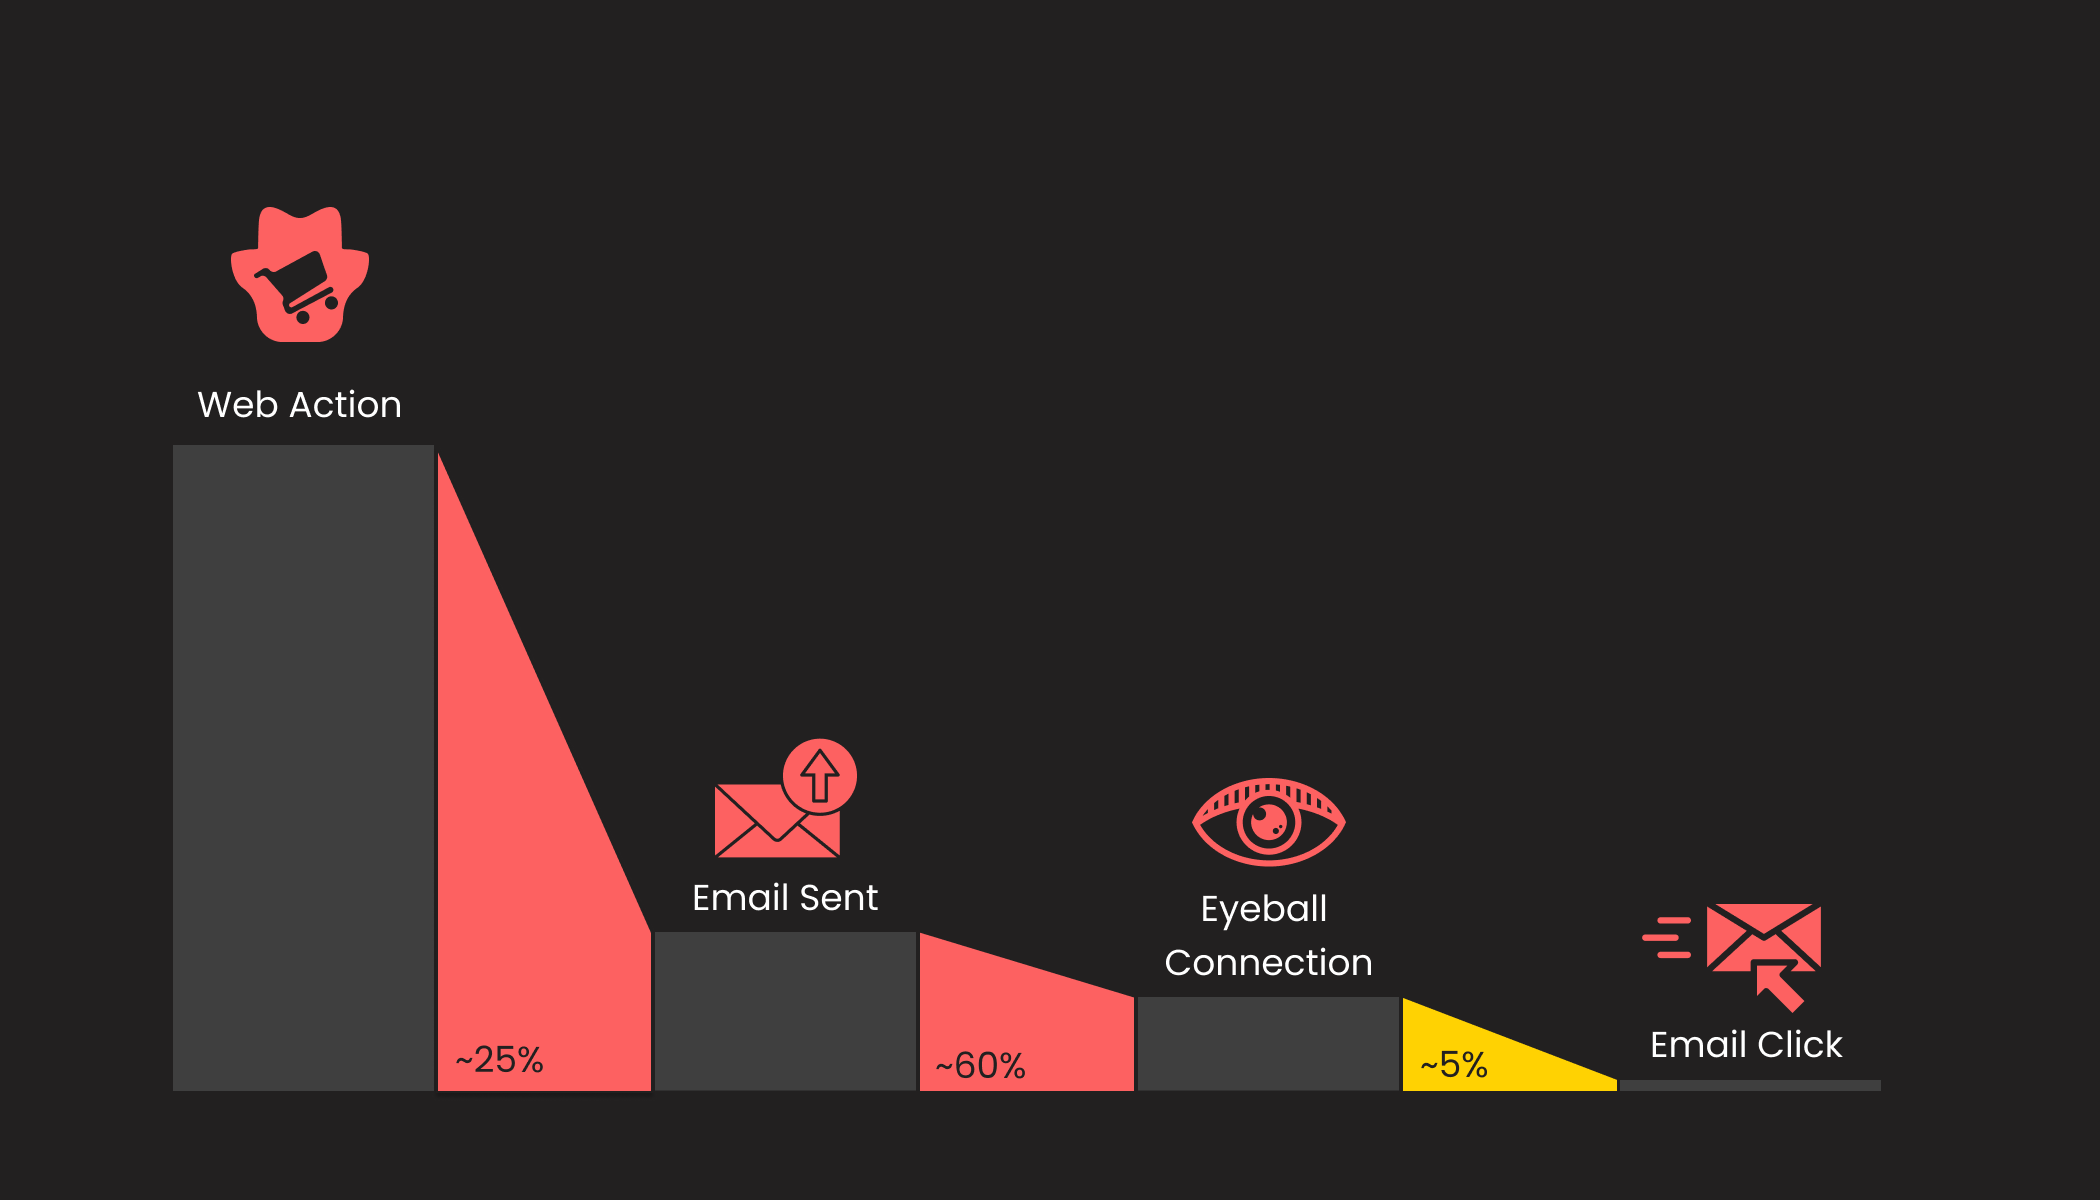
Step 3: From Eyeball Connection to Email Click
How many subscribers take the desired action after noticing the email?
This is the stage where companies typically focus most of their optimization efforts. That isn’t necessarily a bad thing—as long as it doesn’t come at the expense of the earlier stages we discussed above.
This stage is all about maximizing the chances that, when someone notices your email, they will actually open it and click the call-to-action (CTA) button inside.
The tactics for improving click-through rate (CTR) are among the most well-known and widely used in email marketing. They include subject line testing and improving the overall email copy. “Improving email copy” is a broad concept, and there are many elements you can test, such as:
Including or excluding product reviews
Adding a discount or improving the offer for the recipient
Personalization (for example, reminding a customer to use an unused welcome discount when purchasing a specific item)
Testing different language, tone, and creative formats
Adding social proof
…and more.
The primary metric we focus on at this stage is click-through rate (CTR%). A strong benchmark for triggered email campaigns is around 4%.
Brands also commonly track open rate, but in our experience this metric has become increasingly unreliable due to bot-generated opens that occur before the email is actually seen by the user. Since we haven’t found a consistently reliable way to filter out bot activity, we generally do not rely on open rate as a core performance metric.
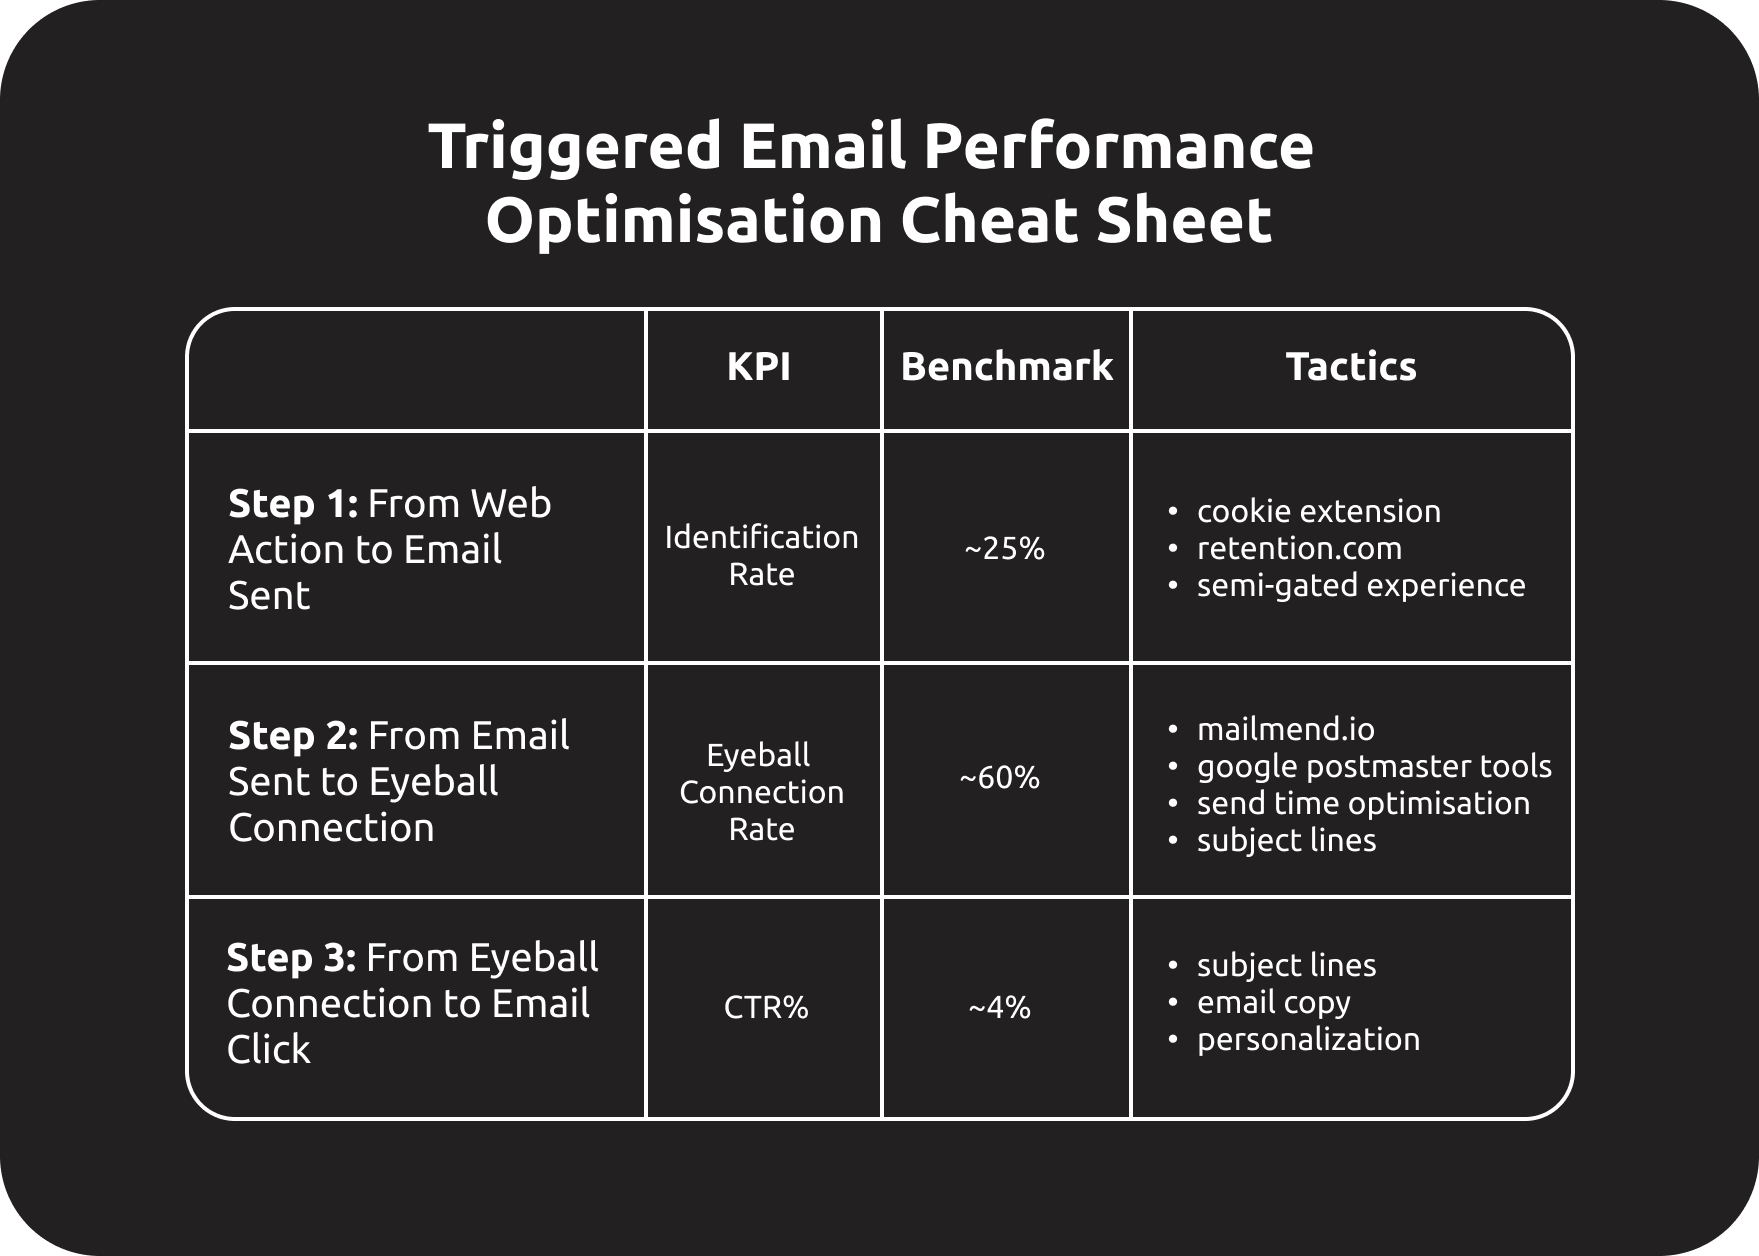
Triggered Email Performance Optimization Cheat Sheet
For your convenience, we’ve summarized the most important information from this article into a simple cheat sheet. Feel free to grab a copy by downloading the image below.
If you found this post valuable…
We hope you found this article valuable. If so, please consider subscribing (for free!) to receive updates on our latest publications.
If you’d like to explore any topics mentioned in the article further, or if there’s anything else we can assist you with, feel free to schedule a meeting with us by clicking the button below: