
The Marketing Techstack in the AI Era for $25m-$2b eCommerce
AI didn't blow up the marketing stack. It quietly rearranged which parts carry the weight. Three regions, no center, and one that suddenly matters far more.

The core components haven’t really changed. What’s changed — after the most intense stretch of learning we’ve had — is which of them suddenly matter far more, and how they fit together. Here’s how we draw the stack now: three regions, and no center.
We’re back to writing, and we’ll be honest about the gap. The last four months have been some of the most intense of our professional careers, and it’s all down to the one topic on everyone’s mind right now — AI. We don’t think we’ve ever learned or adjusted as much in such a short window. Views on things we’d have called settled moved, in some cases completely.
So there’s a backlog of things we want to share: what we picked up, and where our thinking shifted now that we’re properly inside this AI era.
Today’s is the marketing techstack. And the interesting thing, at least to us, is that the AI era didn’t blow up the stack and hand us a new one. The core components are the same ones we’d have named a year ago. What changed is that a few of them matter more than they ever did — and the way they relate to each other reads differently to us now than it used to.
The stack, in three regions
Here’s how we draw it today.
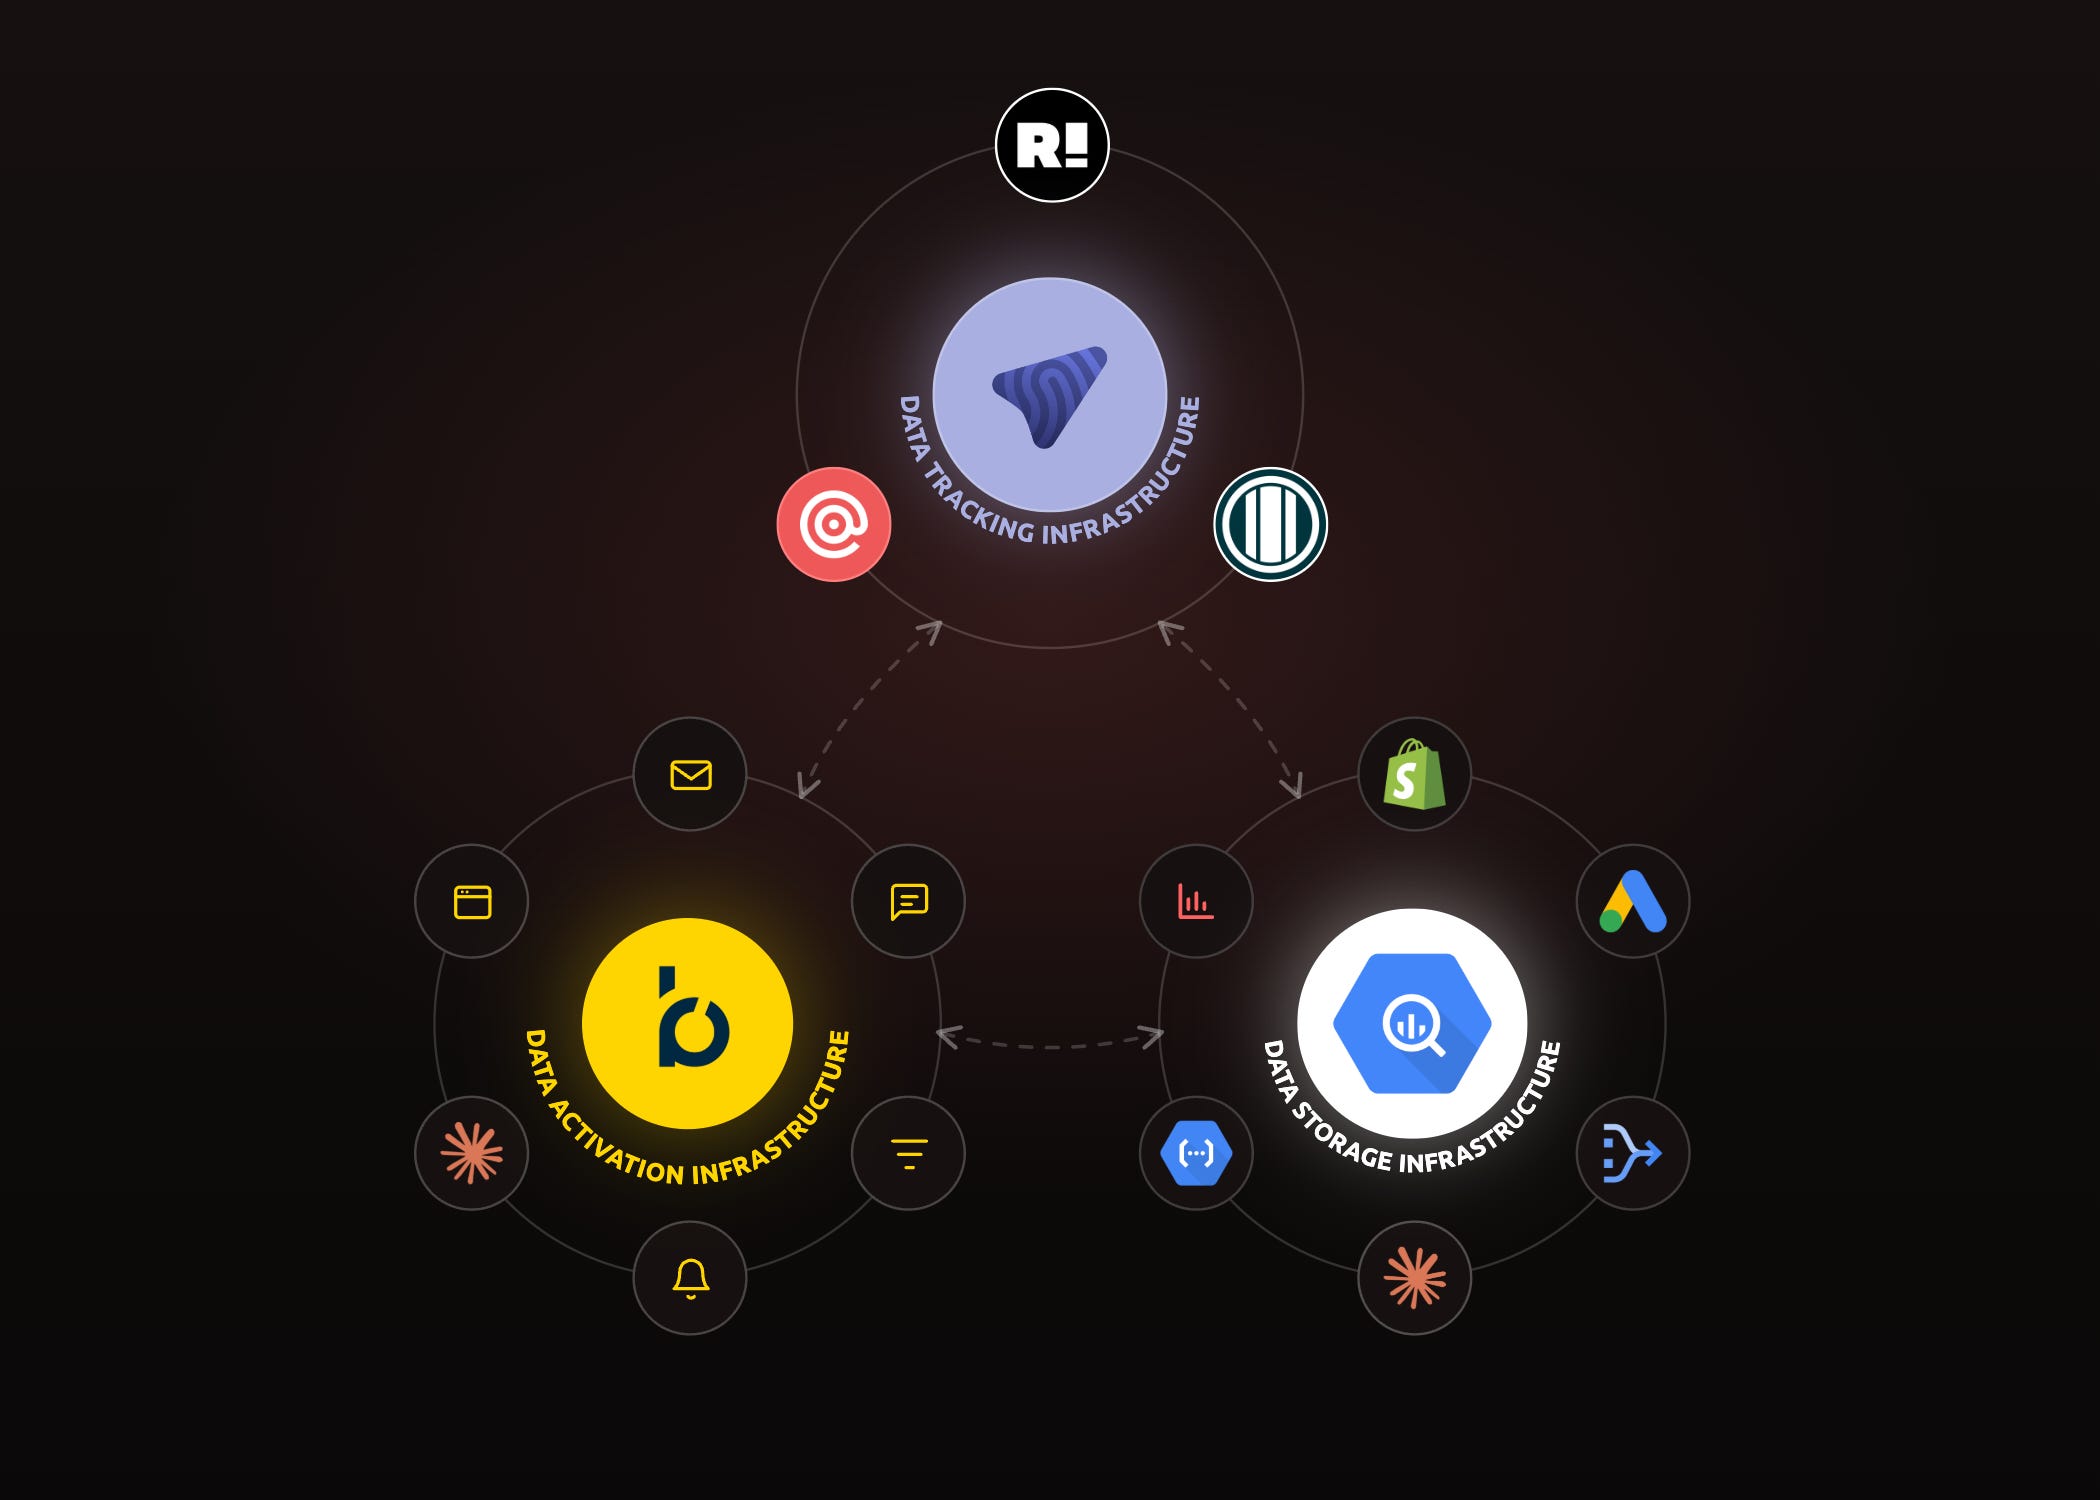
There’s a live, interactive version at techstack.datacop.cloud if you’d rather click through it, but the shape is simple: three regions, connected by data flowing between them — and, the part we’d have drawn differently a couple of years ago, no single platform sitting in the middle that everything else orbits.
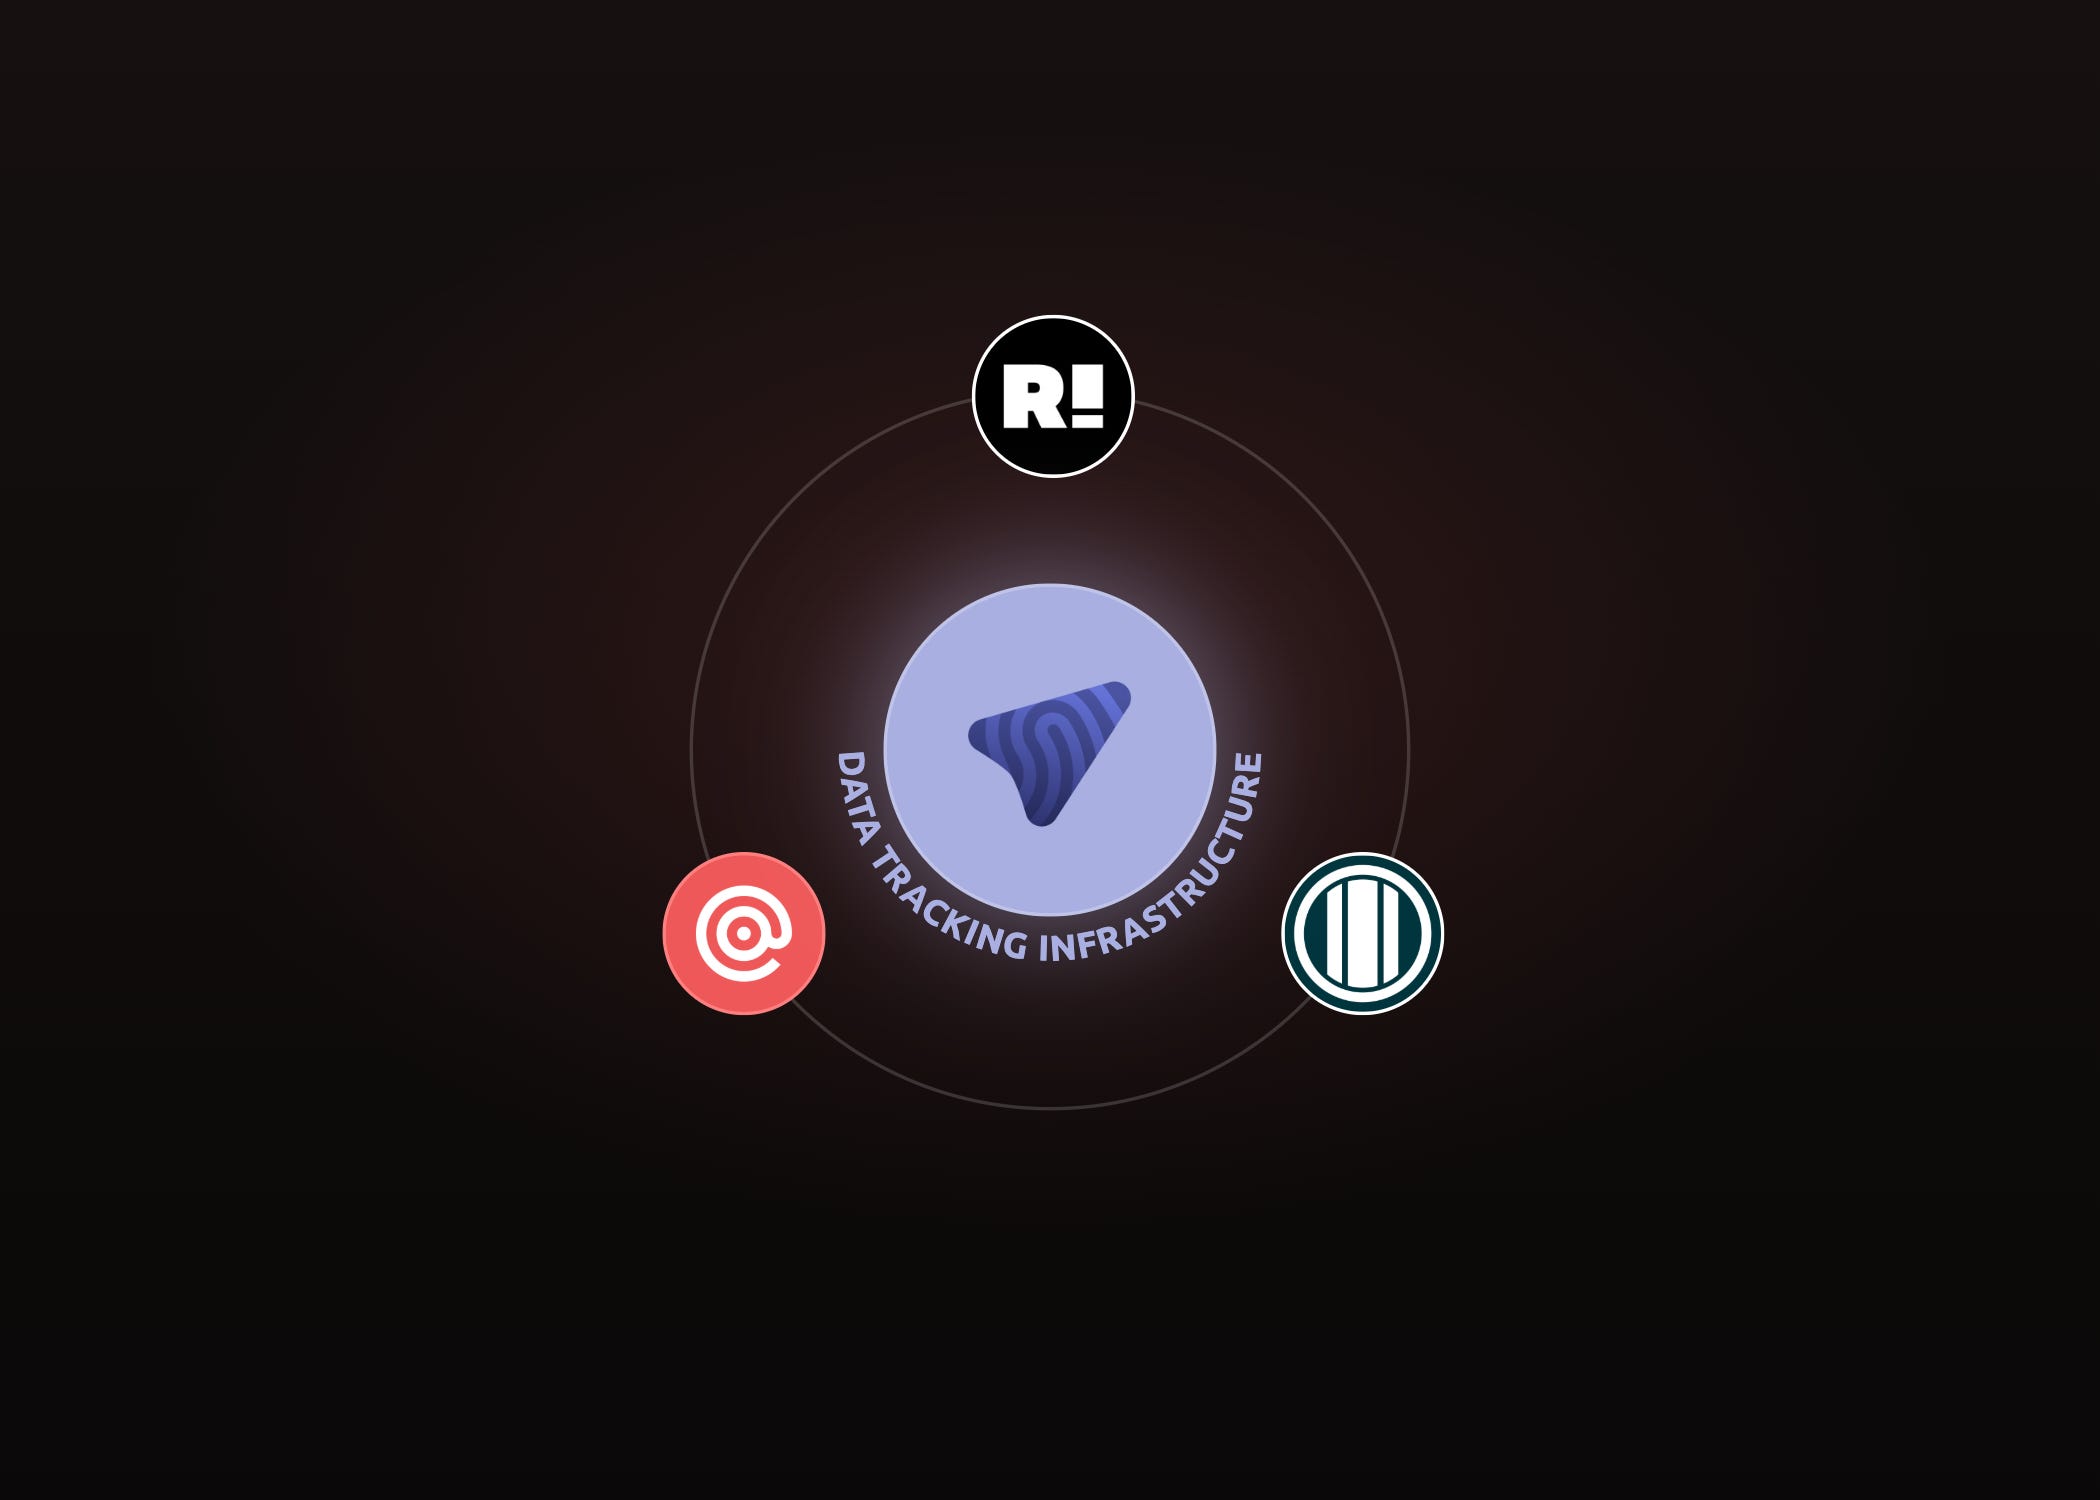
Data Tracking Infrastructure. Its job is to collect clean, complete, compliant first-party data and feed it to the other two regions — which, in the AI era, also means keeping bot traffic out before it pollutes everything downstream. Four functions do the work: server-side collection and routing (MetaRouter), identity resolution and list growth (Retention.com), bot prevention (Human), and email verification (Mailgun).
Data Activation Infrastructure. The hub is Bloomreach Engagement. Its job is delivering personalized, relevant experiences, fast, across every channel — website, mobile app, email, SMS, mobile push, ad audiences.
Data Storage Infrastructure. The hub is the data warehouse — for us, BigQuery. Its biggest source is usually Bloomreach itself: all the customer data you’d expect from a CDP — website behaviour, campaign engagement, offline interactions — flows in here, alongside inventory and orders from Shopify, spend from the ad platforms, and whatever operational data matters. Its job is to hold all of it, cheaply, and to be the layer AI reasons over.
The flow between them is the whole point. Tracking feeds the other two clean data. Storage and Activation then run a loop: the warehouse is the broad, cheap source of truth; Bloomreach is the fast activation muscle; and data moves back and forth between them as needed. There’s no center — three regions, each good at the one thing it exists for.
For years we’d have put one box in the middle and drawn everything around it. What moved us off that is partly the AI era, and it shows up most clearly in the region we’ll start with.
Data & reporting: the region that changed the most
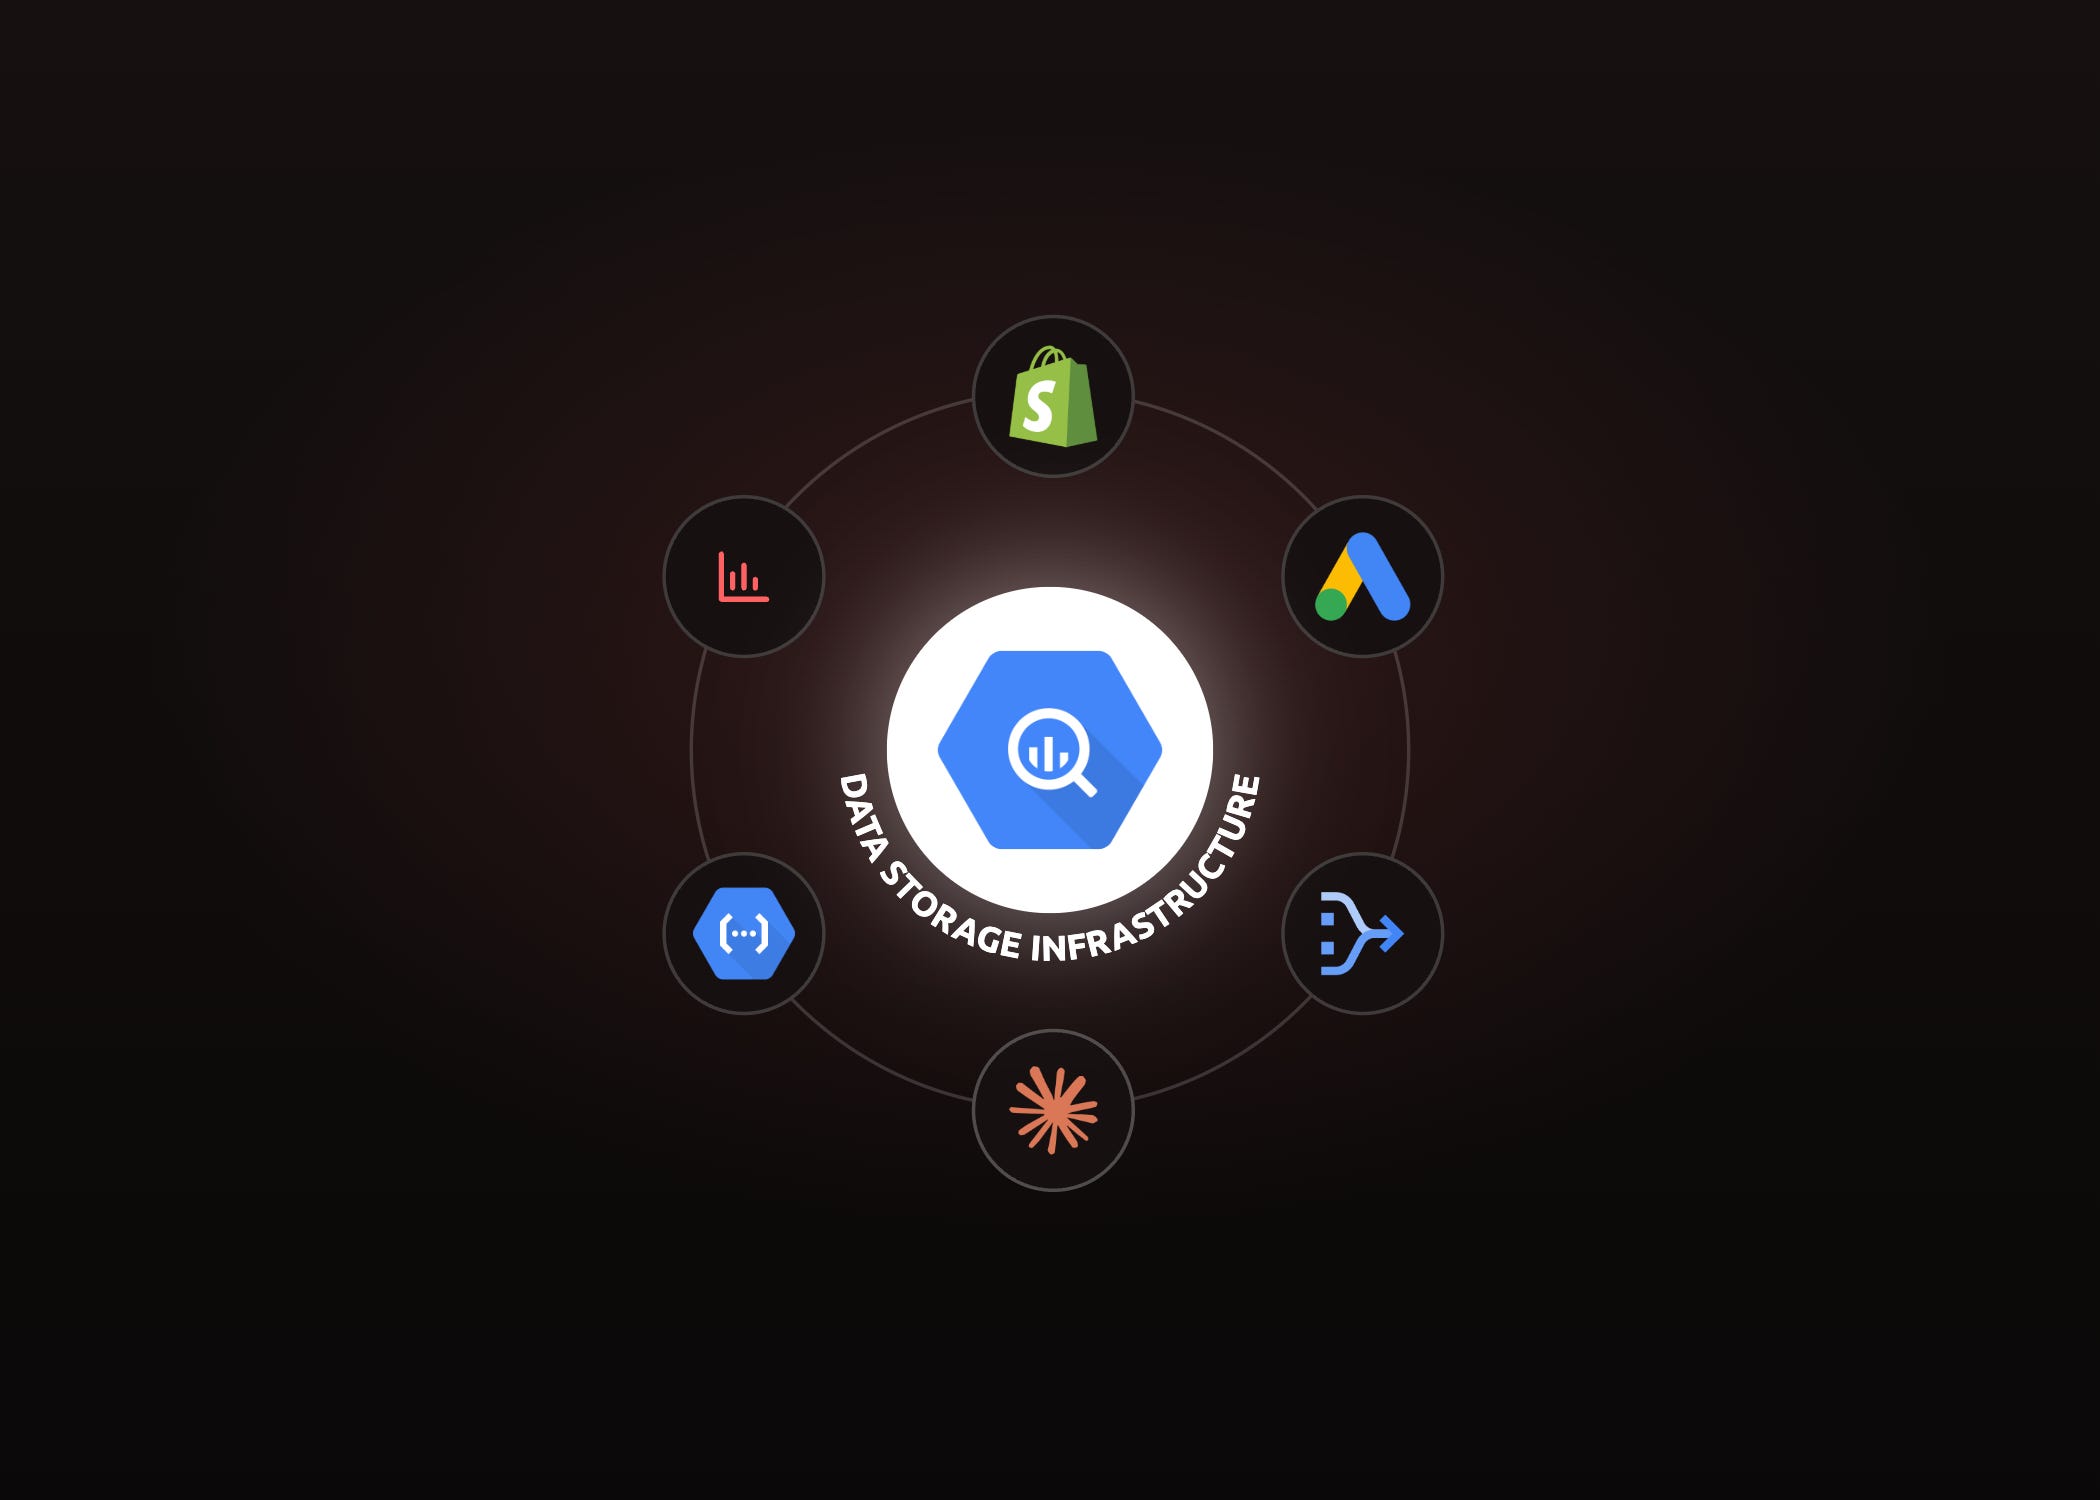
The storage region used to be the quiet one — a cheaper place to park data that didn’t fit in the CDP. It isn’t quiet anymore. For us it’s become one of the most valuable parts of the whole setup, and the reason is straightforward: AI now connects to the data warehouse easily, and once it does, producing quality analytical output gets dramatically easier.
A little context on why the warehouse is the right home for this in the first place. The activation layer runs on a very fast, in-memory database, and that speed costs money — so we keep it lean and don’t hold full data history there. The warehouse is where large volumes of data live cheaply. Bloomreach is usually the single biggest feed into it — all the CDP-grade customer data, website behaviour, campaign engagement, offline interactions — but its scope goes well beyond that: inventory, ad spend, and other operational data all land in the same place. That breadth is exactly what makes AI on top of it so useful — the model can reach across sources that never sat together before.
That unlocks two things, and they’re genuinely different from each other.
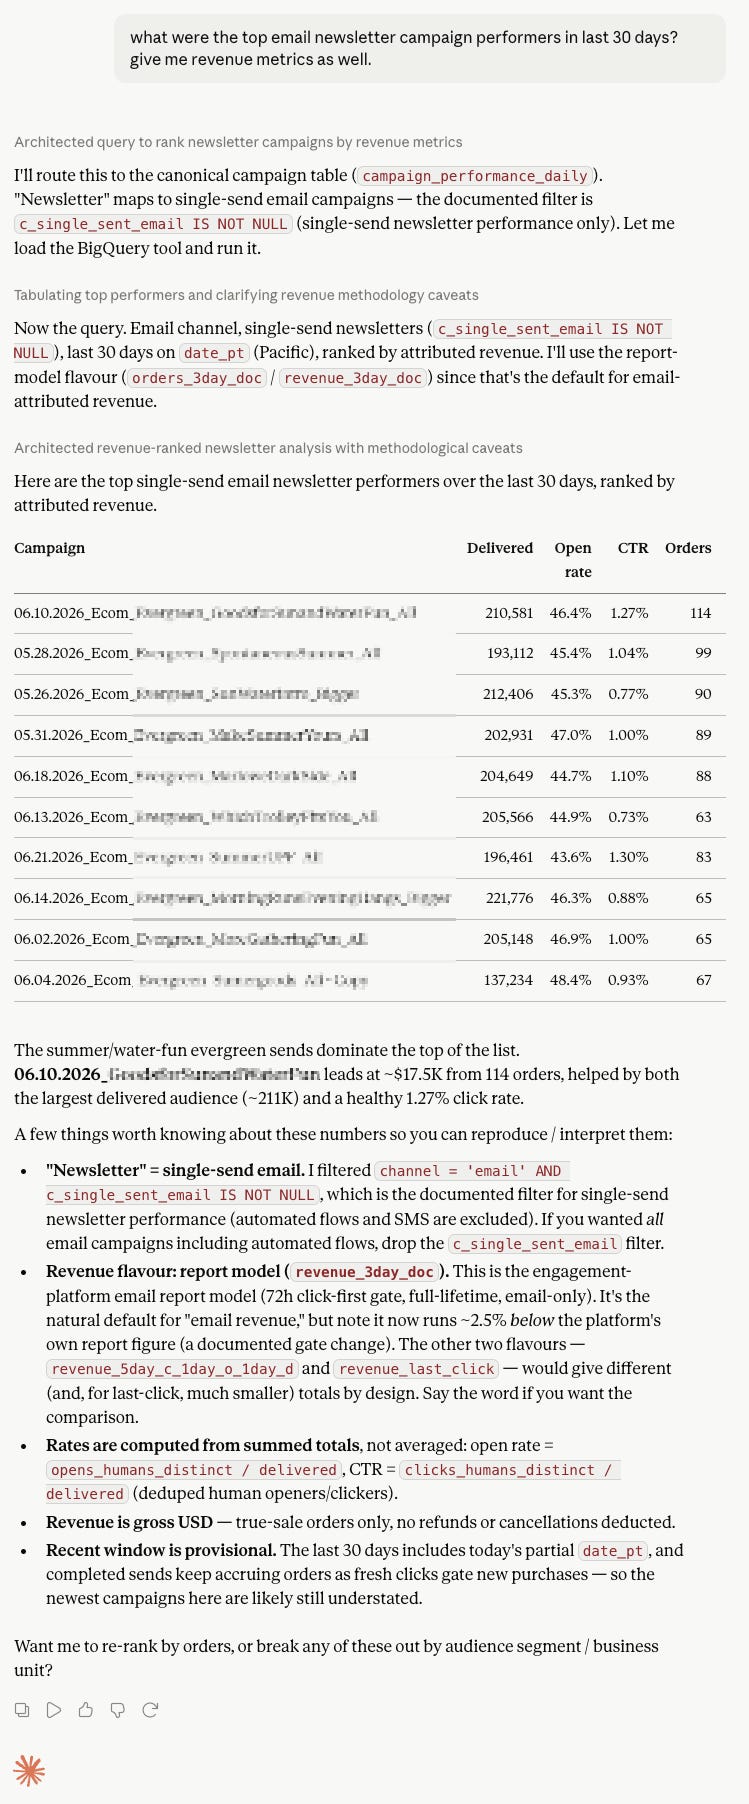
The AI analyst, for ad hoc questions. Point Claude at the warehouse and you get something that behaves like an analyst on call. A question goes in as plain language; the model writes the SQL, runs it, and comes back with an answer that reads across customer data, ad spend, inventory, and operational data together. What used to eat the time wasn’t the chart — it was the twenty minutes of “which table, which join, what does this column mean” between a question and an answer. On a well-modeled warehouse, that friction mostly disappears.
This is where documentation stops being a chore and starts being the thing that makes the whole approach work. The AI navigates the warehouse the same way a new analyst would — by reading what’s there. Clear table and column descriptions, a good written overview of how the warehouse is structured and what each dataset means: that’s what lets the model pick the right table and the right join instead of guessing. We used to treat documentation as hygiene you got to eventually. Now it’s closer to the interface — the better the warehouse is described, the better every answer that comes out of it. To illustrate the kind of question this is built to answer — the sort that used to be a ticket to the data team:
“For products where we’ve spent more than $5k on paid in the last 30 days, show me the ones with under two weeks of inventory left at the current sell-through rate.”
To be straight about it, that particular version — joining paid spend, inventory, and sell-through in one breath — is more where this is heading than where most setups sit today. Getting three clean, distinct sources into one warehouse is real work, and it isn’t a given yet. But the shape is the point: one plain-language question spanning data that used to live in three different places, answered without a ticket.
Permanent reports, the kind that traditionally lived in Bloomreach, Tableau, or Power BI. These are the governed, recurring reports the whole team looks at — different from an ad hoc question because the answer needs to be the same every time and trusted over the long run. Building them used to be slow work: model the data, write the SQL, wire up the source, lay out the dashboard. We now build them with Claude Code, which writes and versions the models against the warehouse and helps assemble the report itself. The output is a permanent, reviewable asset rather than a one-off answer.
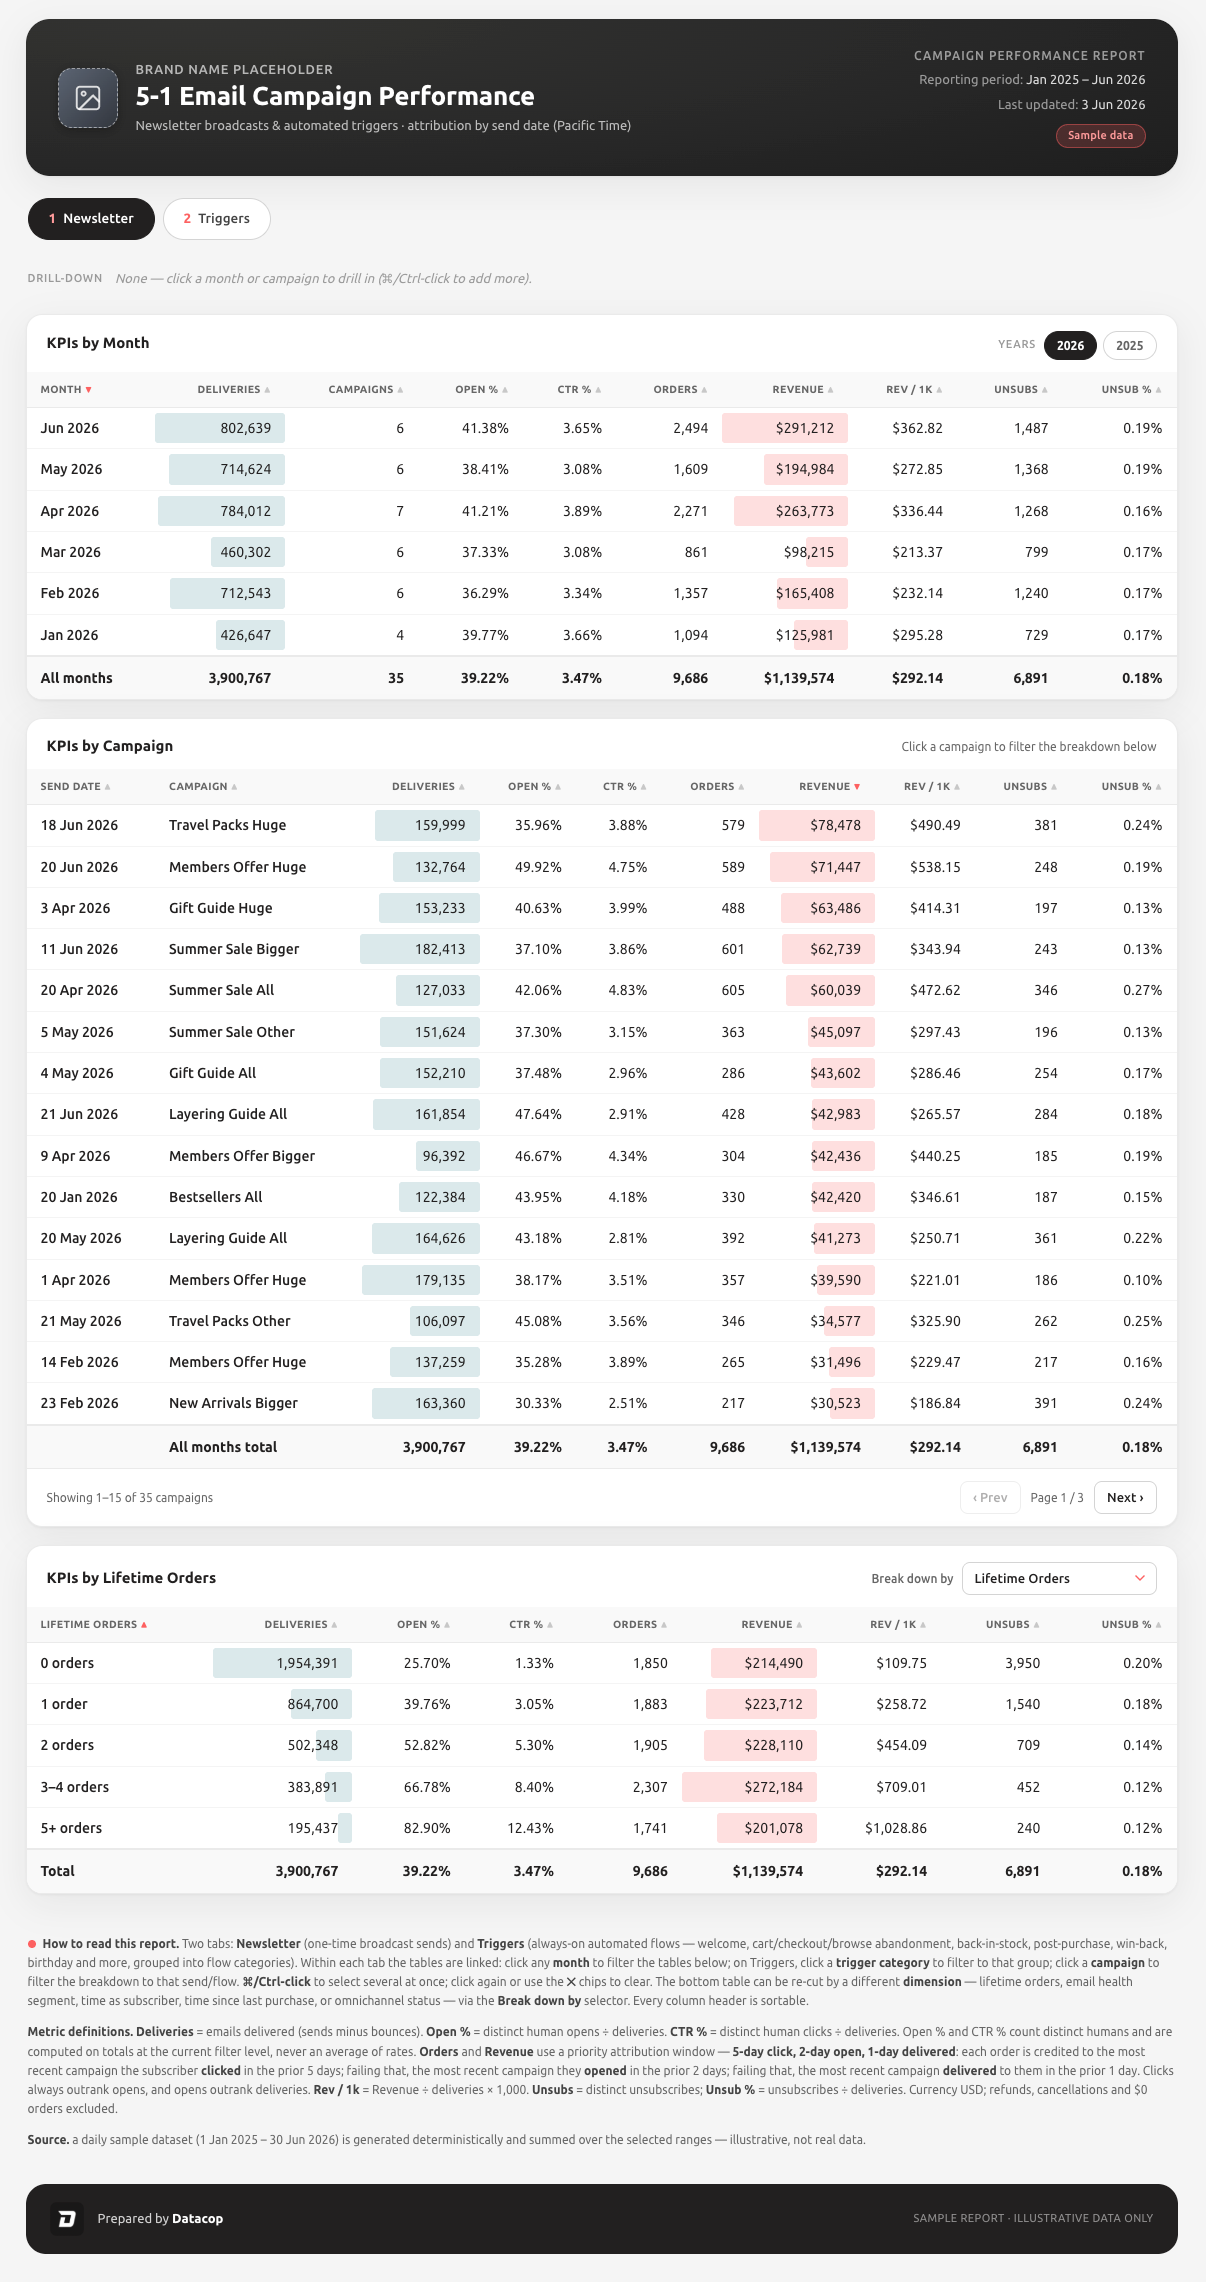
An example of a recurring report we now build directly in Claude Code with natural language — no Tableau or Bloomreach required: https://5-1-campaign-performance.datacop.cloud/
One thing worth being honest about, because it’s easy to get swept up: AI on a clean, well-modeled warehouse is a genuine step change, but AI on a messy one just produces confident wrong answers faster. The quality of everything in this region is capped by the quality of the data feeding it. Which is a big part of why we now think about the tracking region differently, too — but we’ll come back to that.
Bloomreach: still the activation layer, now with easier assets
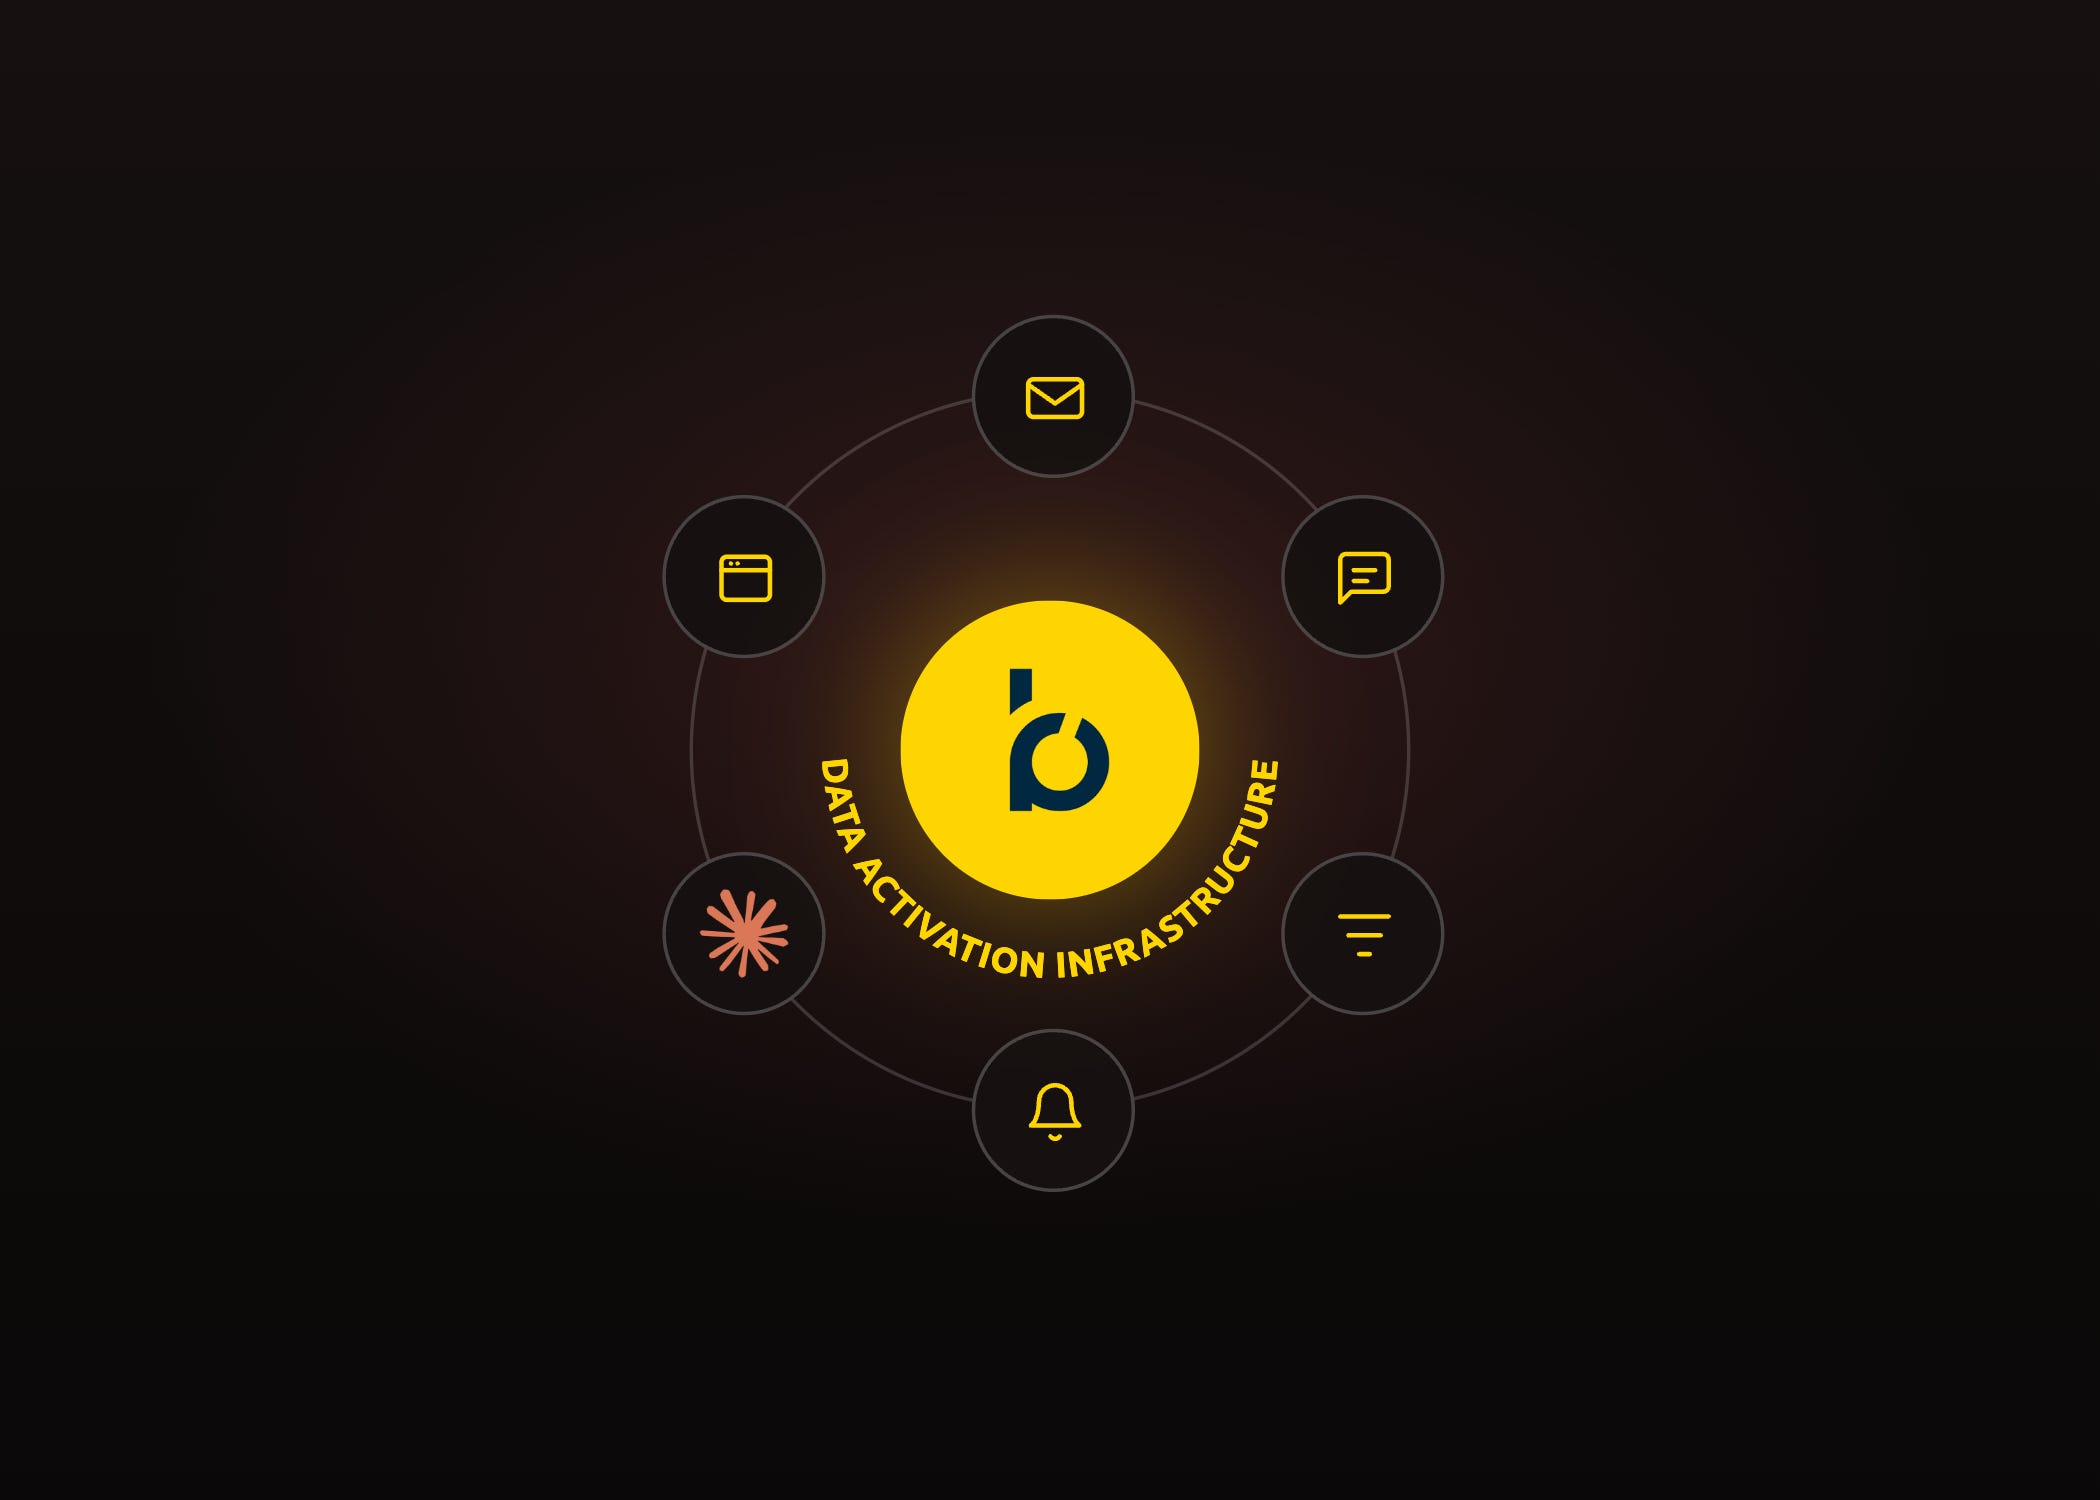
Not much has changed in our view of the activation region: Bloomreach Engagement is still the main activation layer, and we still think it’s the strongest option for the job. It’s built around an in-house CDP on that fast, in-memory database, which is what lets personalization resolve in seconds across channels. And because website personalization, email, SMS, push, ad audiences, and the customer database are all parts of one platform, you’re maintaining a single data model instead of six, and you’re not stitching pipelines between separate tools to keep everything in sync.
What did get easier in the AI era is asset creation. The two that used to be the most time-consuming — building email assets and building web layers — have compressed a lot for us, because we’ve built workflows around Claude that generate them and import them straight into Bloomreach. That’s a whole topic on its own, and it deserves its own article rather than a paragraph here, so we’ll go deep on those workflows separately. For now it’s enough to say it’s the reason Claude shows up on the ring around this region in the diagram.
Data tracking infrastructure: quiet, essential, and more important than ever
If the AI era made the storage region more valuable, it made the tracking region more important — because clean input is now the thing standing between you and confidently wrong AI output.
The job of this region is to put complete, clean, compliant, human first-party data into the rest of the stack. We find it clearer to think about it as a set of functions rather than a set of logos — the tool picks are secondary and interchangeable; the functions are what the region has to cover.
Collection and routing. You need behavioural data off the site — cleanly, once, without a dozen tags dragging performance down. That means a single server-side collection point that owns the anonymous ID (so identity lives in your own infrastructure, not in whichever tool fired first, and swapping an activation tool later doesn’t orphan your anonymous users), routes events to every downstream system, and lets you decide where each event goes — high-volume, low-value events like product impressions to the cheap warehouse, the rest to the fast activation layer. The tool we use for this is MetaRouter.
Bot prevention. This is the function the AI era pushed to the front, and the one we’d underplayed before. The web has a fast-growing bot problem, and automated traffic quietly poisons everything: it inflates your numbers, pollutes your behavioural data, and stuffs your lists with signups that were never people. Since something downstream is now reading all of that literally, filtering non-human traffic out at the door has gone from nice-to-have to load-bearing. The tool in our orbit for this is Human.
Identity resolution and list growth. Resolving anonymous visitors to known profiles, stitching the same person across devices and sessions, and growing the addressable list. The tool we use is Retention.com — with the honest caveat we give every client that it’s US-only, because the approach is illegal under GDPR, and they’re open about that.
Email verification. Keeping invalid and junk addresses out of your sends so your sender reputation holds up — which matters more the harder the rest of the region is working to grow the list. The tool we use is Mailgun.
None of this is new in concept. What’s new is the stakes. When a human reads a slightly dirty dataset, they squint and adjust. When AI reads it, it produces a clean, fluent, wrong answer and hands it to you with total confidence. So the least glamorous region on the diagram is the one we’d now argue quietly protects the value of everything else.
Where that leaves us
Same components, rearranged in how we see them. The stack didn’t get replaced by AI; it got a new center of gravity — or rather, it lost its center entirely and became three regions that each earn their place. Storage went from a parking lot to the layer that answers questions. Activation stayed where it was but got faster to build for. And tracking, the quiet base, turned out to matter more than ever now that something downstream is reading the data literally.
That’s how we see it at the moment, anyway. It’s a perspective, not a prescription — this is simply where four unusually intense months landed us, and we wanted to share it while it’s fresh. The interactive model is at techstack.datacop.cloud.
If you found this post valuable…
We hope this article was valuable to you. If you enjoyed it, don’t miss out on future articles—subscribe for free and have our latest content delivered straight to your inbox.