Revenue Loss Prevention Slack Notifications
Have you ever experienced the frustrating moment of realizing that your cart update event isn't triggering consistently, resulting in missed opportunities to send cart abandonment emails to...
Have you ever experienced the frustrating moment of realizing that your cart update event isn't triggering consistently, resulting in missed opportunities to send cart abandonment emails to potential customers?
Perhaps there was a time when a crucial automated email flow unexpectedly halted, and you only discovered the snag a week later. Or maybe, there was a significant traffic anomaly that remained undetected for two weeks, affecting your data insights and strategy.
Imagine the wasted resources in continually allocating your advertising budget to promote a product that, unbeknownst to you, was out of stock.
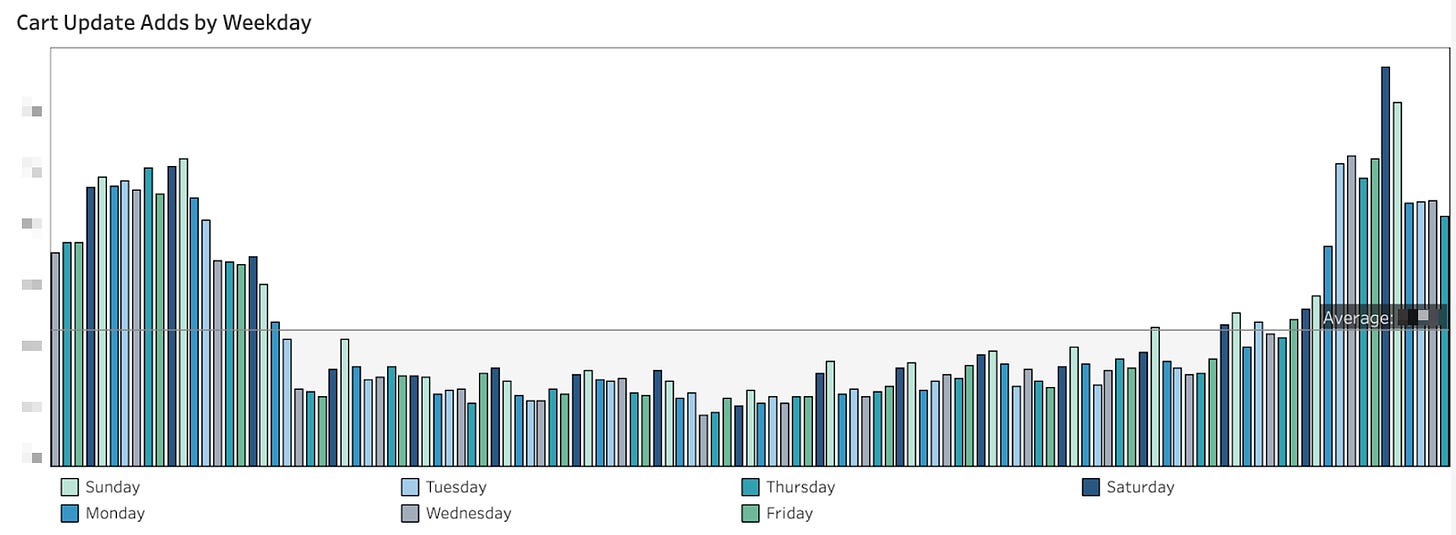
Over our seven-year tenure in the industry, we've encountered numerous challenges related to data quality. A notable example involves a significant data outage that impacted 'cart_update' events, crucial for triggering cart abandonment workflows. In one project, we observed that approximately 50% of these events went untracked for three months. This oversight resulted in a roughly 50% decrease in cart abandonment revenue during that period.
In another example below, we can see that the number of units in a transaction (purple) “this year” started to decline compared to the previous year around the beginning of August, while before that, the UPT trailed relatively evenly, although somewhat below last year’s rate. In August, there is a recognizable downward trend.
This kind of continuous trend with a modest, but increasing shift suggests a change in the UX, Product offering or something else user-driven.
In this particular example, it was the change in the logic of the pricing threshold of when Free Shipping is enabled for checking out customers.
Lastly, here is an example of duplicate 'refund_item' events entering our CDP platform just one second apart. This was causing the overcounting of refunded revenue in our reporting.
The objective is to identify them promptly, minimizing their repercussions on revenue and data quality.
This very reason drove us to develop a Slack notification system. It alerts us immediately whenever there's a significant anomaly, positive or negative, or any undesirable event — like allocating a sizable portion of our marketing budget to a product that's out of stock.
How we designed our Slack notification system
1. Positive and negative anomalies
The first type of notifications we've implemented alerts us of any positive or negative data anomalies.
So, how do we differentiate between positive and negative anomalies?
Suppose we're monitoring traffic (in terms of number of sessions). Consider that yesterday was a Wednesday, and we wish to ascertain if the sessions recorded deviated significantly from our historical data for that weekday.
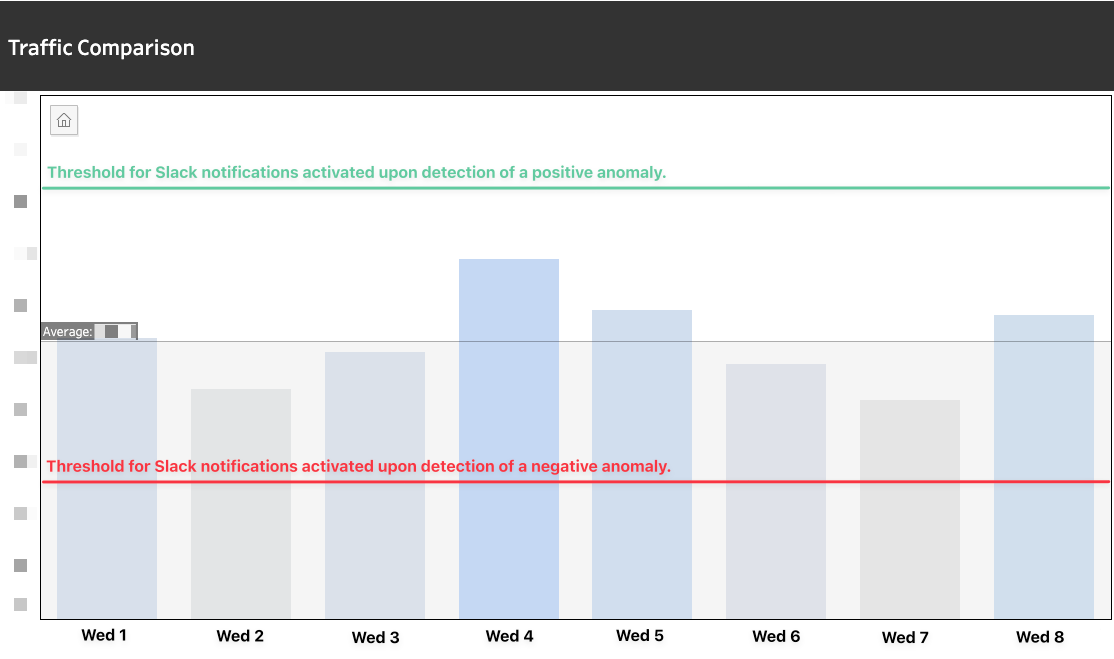
Our approach is simple: We review the session data from the last 8 Wednesdays and compute the average. A notification is then triggered in the following scenarios:
Should the sessions of the most recent Wednesday fall below 50% of the average of the past 8 Wednesdays, we're alerted to a negative anomaly.
Conversely, if the sessions exceed 150% of the eight-week average, it indicates a positive anomaly, and we're accordingly notified.
For a clearer understanding, please refer to the screenshot below.
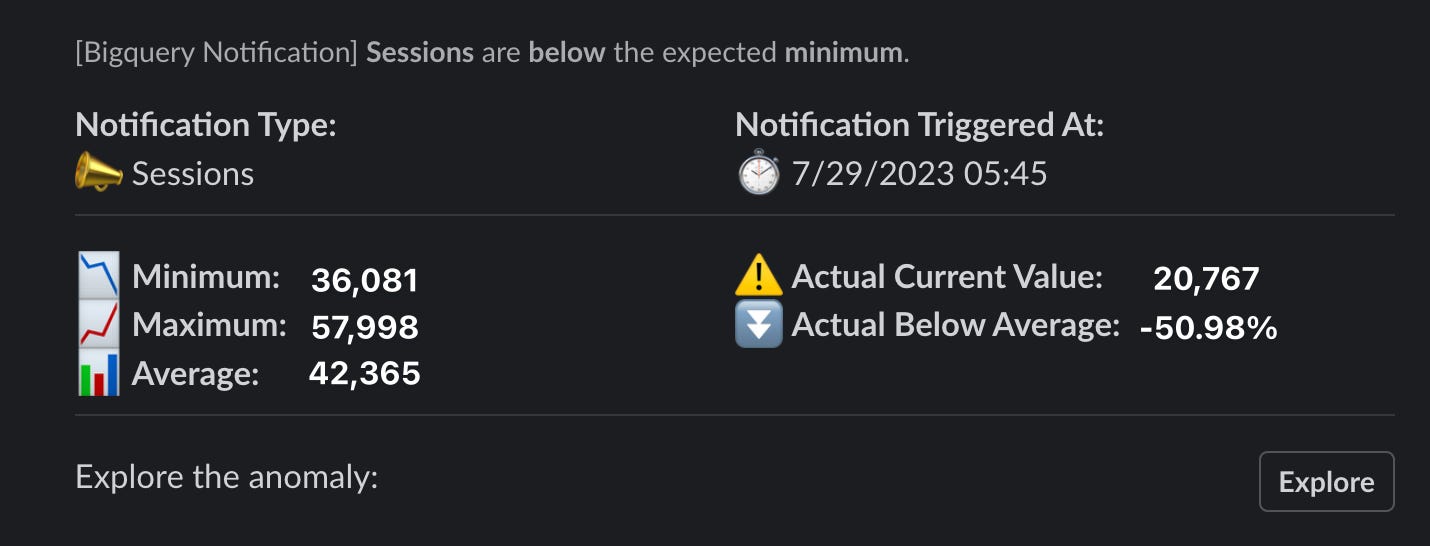
Should the traffic dip below the red lines in the above image, we'll receive an alert in our designated Slack channel. (Please note: the numbers in the notification are anonymized.)
📉 Minimum: Reflects the lowest count of daily sessions over the past 8 Wednesdays.
📈 Maximum: Represents the peak count of daily sessions from the last 8 Wednesdays.
📊 Average: Denotes the average count of sessions accumulated over the last 8 Wednesdays.
⚠️ Actual Current Value: Indicates the session count from the most recent Wednesday.
⏬ Actual Below Average: Measures the percentage difference between the “📊 Average” and the “⚠️ Actual Current Value.”
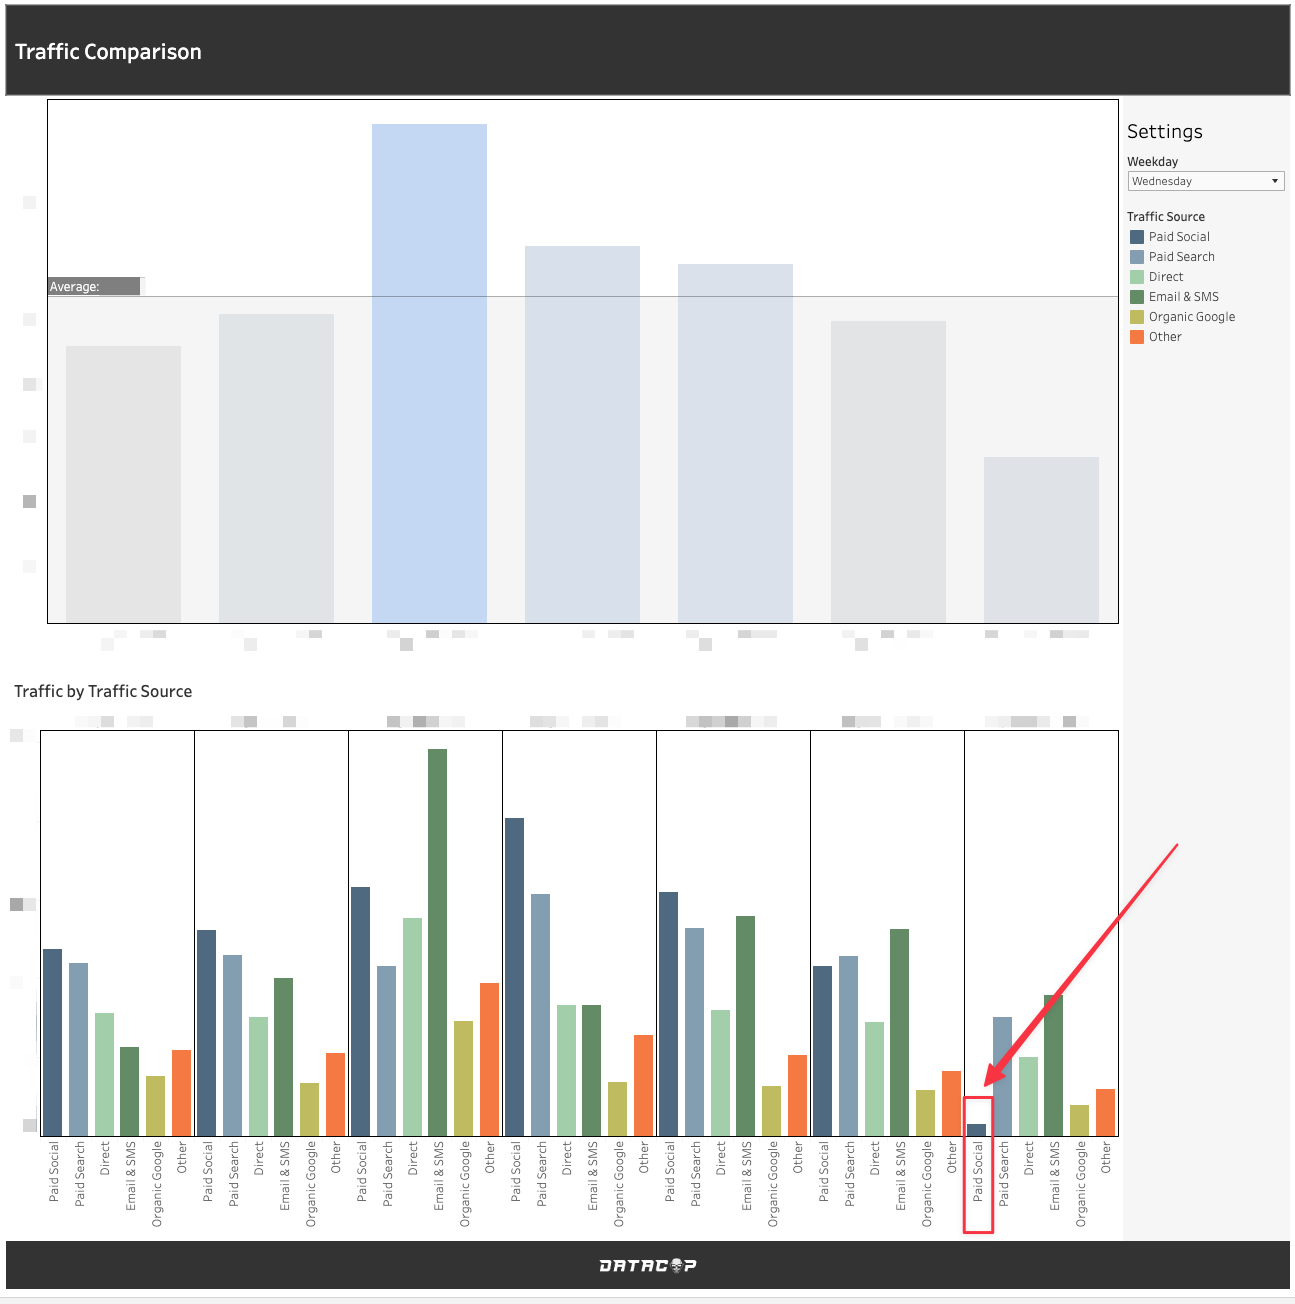
Clicking the “Explore” button at the bottom right will direct you to a detailed report, which is displayed as follows:
In the upper chart, the total number of sessions from the last 8 Wednesdays is depicted. It's evident from the data that the most recent Wednesday experienced an unusually low traffic volume.
The lower chart breaks down session traffic by source, facilitating quick identification of factors contributing to any anomalies.
From this specific data, it's evident that the "Paid Social" traffic was virtually absent last Wednesday. This suggests that our paid campaigns on platforms like Facebook weren't operating as they typically would, either intentionally or inadvertently.
Beyond just monitoring traffic, as of this article's writing, we monitor 18 other metrics. These include Revenue, Number of Orders, Units Sold, Conversion Rate, Number of Add-To-Cart events, Average Products Viewed per Session, and more.
Such comprehensive monitoring ensures we can promptly detect and respond to any shifts in our KPIs, whether they're positive or negative.
2. Real-time data monitoring
The second set of Slack notifications centers on real-time oversight of marketing automation and data tracking processes.
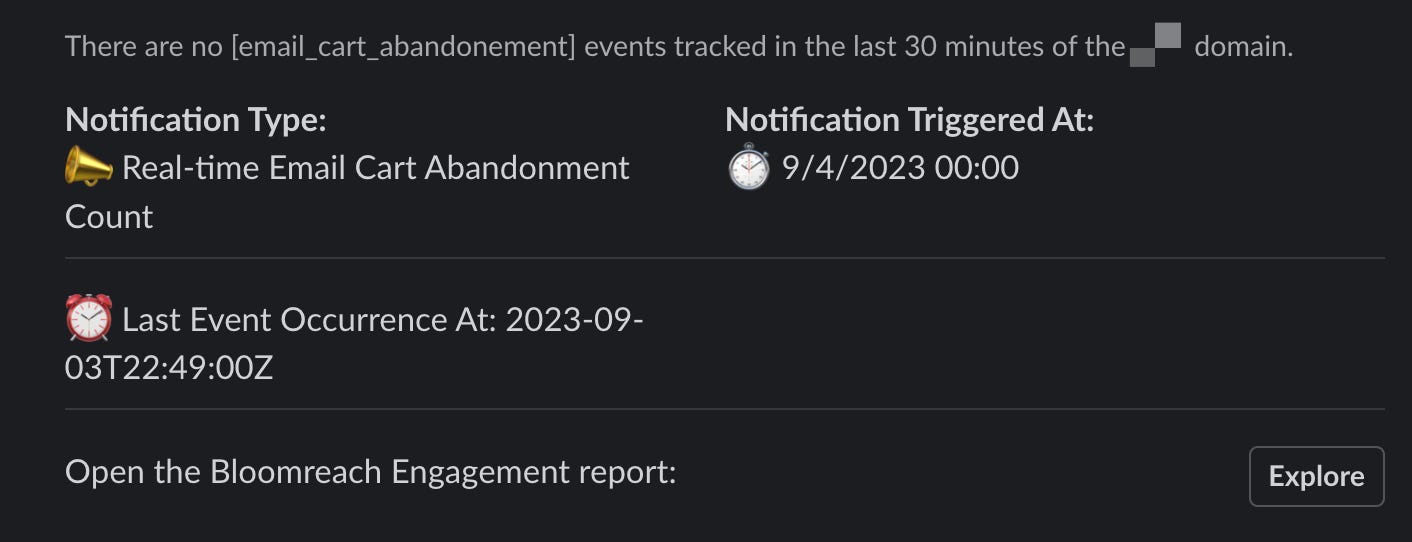
For instance, a notification is triggered if no cart abandonment email has been dispatched in the past 30 minutes. However, the specific time interval may vary depending on the scale of your eCommerce operation.
Clicking the "Explore" button will take you directly to the system handling email automation; in our instance, that's Bloomreach Engagement.
For real-time alerts, we monitor various data flows. This includes tracking the flow of back-end activities like purchase, refund, and exchange events into the Bloomreach Engagement platform, observing the triggering of frontend events, and ensuring that website visitors progress through each stage of the checkout funnel.
Such notifications are invaluable, promptly alerting us when discrepancies arise.
3. Custom occasions
Ever realized you've been allocating a marketing budget to a product that's already out of stock?
Or perhaps you'd like an alert for a sudden increase in the refund rate for a particular product or category.
As long as you can quantify it, you can set up a Slack notification for any event.
Beyond the scenarios mentioned, which events would you find valuable to monitor? Share your thoughts in the comments below.
Setting up the Slack Notifications
When establishing the initial version of our Slack notification system, we found invaluable guidance from this article on creating Slack alerts using data stored in the BigQuery DataWarehouse.
You're welcome to set them up independently! If you require assistance, don't hesitate to contact us at www.datacop.services. We're here to assist you.
If you found this post valuable…
We hope you found value in this article. If you did, we'd appreciate it if you subscribed (at no cost!) to stay updated with our latest publications.


