Our Revenue Forecasting Model That Proved to be Quite Accurate
Revenue forecasting is a critical analytical task for every eCommerce company. In this article, we delve into our methodology for projecting revenue in eCommerce businesses.
Revenue forecasting is a critical analytical task for every eCommerce company. In this article, we delve into our methodology for projecting revenue in eCommerce businesses.
Typically, revenue in eCommerce can be segmented into two main categories:
New Revenue (Acquisition): This includes revenue from customers who are purchasing from your brand for the first time.
Repeat Revenue (Retention): This consists of revenue from customers who have previously purchased from your brand and have chosen to do so again.
The distribution of revenue across these two categories varies significantly depending on the industry vertical and the maturity of the business. For instance, an established eCommerce business might derive over half of its revenue from repeat customers. In contrast, a business that started just a year ago might see upwards of 90% of its revenue coming from new customer acquisitions, given that its existing customer base is likely quite small.
To develop our forecasting model, we need to make one key decision and consider three assumptions:
Decision:
Will our marketing budget for the upcoming year be the same, smaller, or larger compared to the previous year?
Assumptions:
Will the effectiveness of acquiring new customers remain constant, decrease, or increase?
Will the average order value of newly acquired customers stay the same, decrease, or increase?
Will the average repeat revenue per customer be consistent, higher, or lower compared to previous periods? (This is linked to the forecast for repeat revenue, which I'll elaborate on later in the article.)
New Revenue Forecast
Let’s assume it's the end of 2023, and we are aiming to forecast revenue for each month of 2024.
The first step involves forecasting New Revenue. Gathering data for the following table should be straightforward for any eCommerce business:
In the table above, we focus on three key inputs:
Number of Acquired Customers: This represents the count of individuals making their first purchase from your business.
New Revenue: The total revenue generated by these first-time customers.
Acquisition Advertising Spend: The expenditure on campaigns aimed at acquiring new customers. If distinguishing between acquisition and retention spending is challenging, consider using the total advertising budget.
These inputs enable us to calculate two essential metrics:
Average Order Value (AOV): Calculated as New Revenue divided by the Number of Acquired Customers, this metric indicates the average spending amount of each new customer on their first order.
Customer Acquisition Cost (CAC): Derived by dividing Acquisition Advertising Spend by the Number of Acquired Customers, CAC reveals the average expense incurred to acquire a single new customer.
For forecasting New Revenue in 2024, we need to address certain decisions and assumptions:
Decision: Will we increase or decrease our marketing budget for customer acquisition?
Assumption 1: What will our AOV be in the upcoming year?
Assumption 2: Will our CAC increase, decrease, or remain constant? Given the trend of diminishing personalization and rising costs in advertising on platforms like Google or Facebook, an increase in CAC year over year is advisable.
Suppose we decide to boost our customer acquisition marketing budget by 15%, anticipate a 2% rise in AOV, and expect a 10% increase in CAC. With these factors in mind, we can easily compile the following table to forecast New Revenue for the next year. The template is available here for your use and customization.
Repeat Revenue Forecast
Forecasting repeat revenue using our model is somewhat more complex than projecting new revenue, yet it has proven to be highly accurate for our clients.
The initial step involves gathering historical data on monthly repeat revenue. The goal is to organize this data in a manner akin to the following table:
The next phase focuses on breaking down repeat revenue figures by customer acquisition date. For instance, let's consider that in December 2023, our total repeat revenue amounted to $759,033.
We then aim to determine how much of this revenue was generated by customers acquired in different periods: in the same month (December 2023), one month prior (November 2023), two months earlier (October 2023), and so forth.
This analysis results in a table that categorizes repeat revenue based on the month of customer acquisition. A detailed version of this table is accessible in Google Sheets via this link.
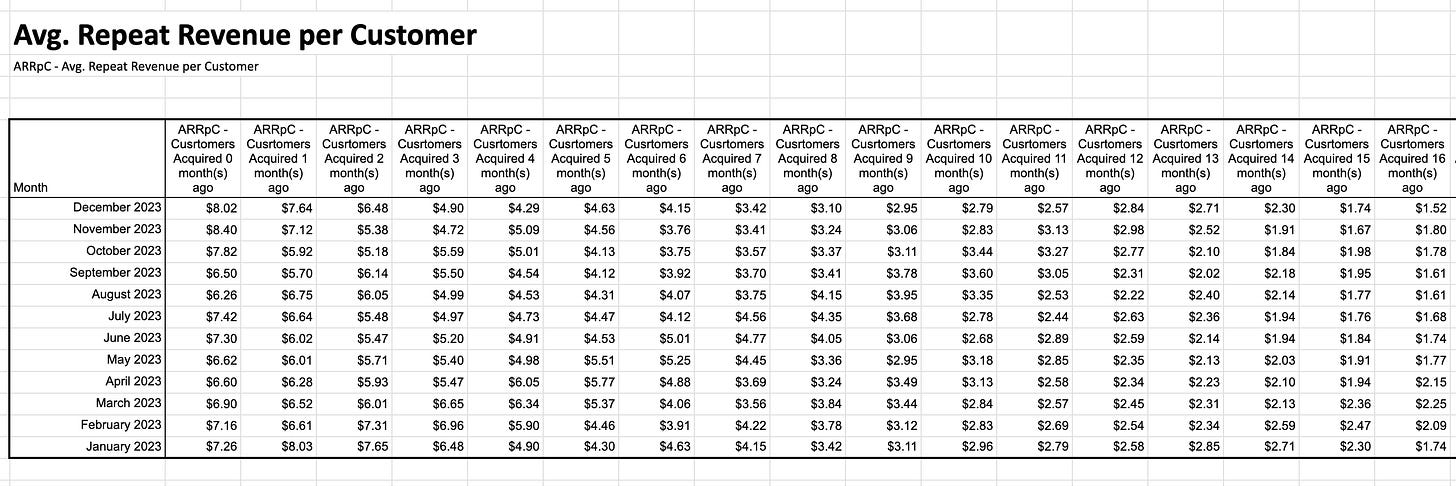
The subsequent step in our analysis involves determining the average repeat revenue per acquired customer in each cohort.
Take, for instance, November 2023, when we acquired 13,191 customers. These customers generated $100,832 in repeat revenue during December 2023. To calculate the average repeat revenue per customer for this cohort, we divide $100,822 by 13,191, resulting in an average of $7.64 per customer.
By applying this calculation across all cohorts, we compile a table that reflects the average spend per customer based on their tenure with the brand.
Having established the average amount spent by each customer relative to their duration with the brand, we are now equipped to forecast future repeat revenue effectively. Here's the process:
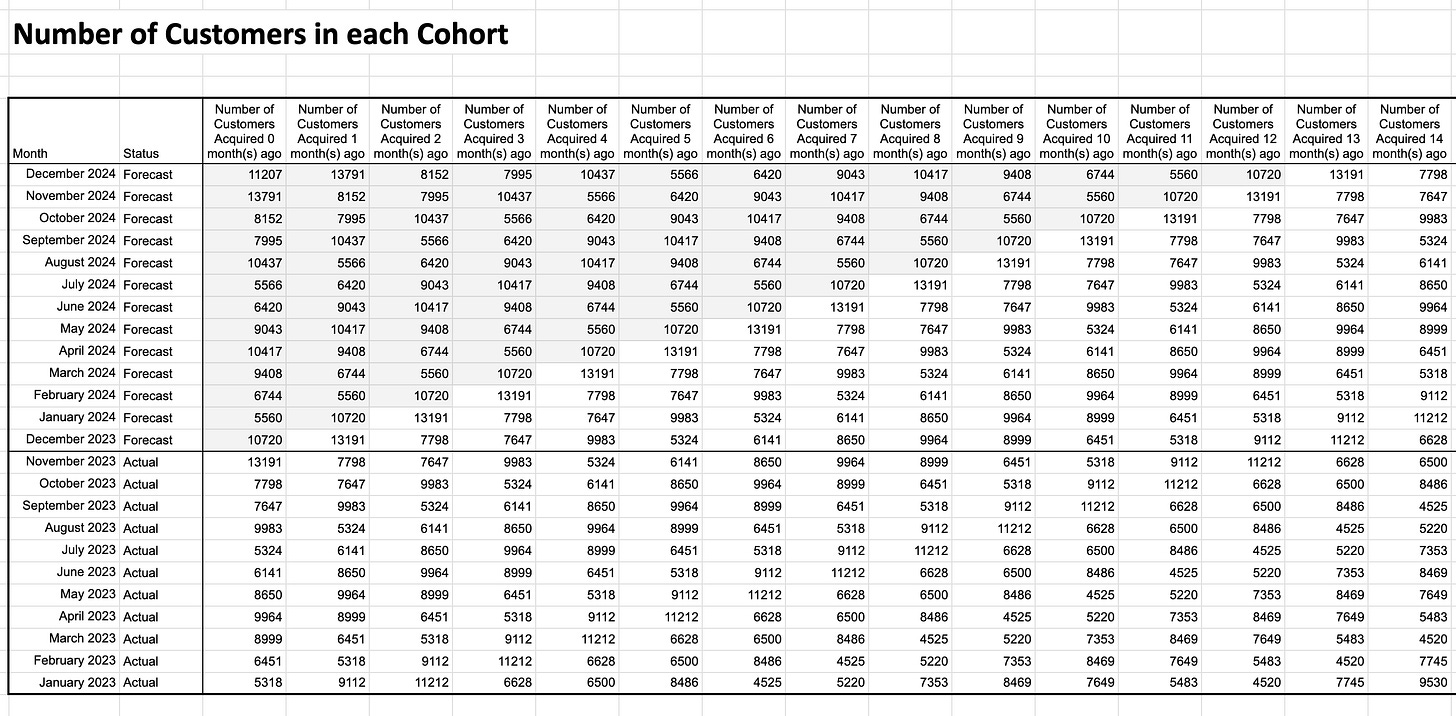
Utilizing the 'New Revenue' Forecast: We begin by referring to our 'new revenue' forecast, which provides predictions for the number of customers we expect to acquire each month in 2024.
Incorporating Predictions into the Table: We then input these forecasted customer numbers into a table that mirrors the structure of the previous table. In this format, forecasted numbers are denoted in grey, while actual figures are displayed in white.
As we progress with our forecasting model, there's an additional assumption that needs consideration: Will the average repeat revenue per customer remain constant, decrease, or increase in the future?
Our analysis of historical data from various clients indicates that the repeat revenue per customer typically shows a downward trend over time. Based on this observation, we recommend incorporating a decay rate of 10-15% into your forecasts, unless there's compelling evidence to suggest a different trend.
With this assumption in place, we can proceed to estimate the expected average repeat revenue per customer for each customer cohort in 2024. In the example table that follows, we have factored in a 10% annual decay rate.
The final step in our forecasting process involves a straightforward calculation: multiplying the number of customers in each cohort by the average repeat revenue per customer. This yields a comprehensive table that illustrates the projected repeat revenue for each cohort, as shown below:
We have now successfully forecasted both new and repeat revenue for 2024. By summing these two figures, we arrive at the comprehensive total revenue forecast for the year.
If you have any questions about this model or need further clarification, please don't hesitate to ask in the comments below or contact me via email at lukas@datacop.services.
I realize that fully understanding this step-by-step guide might require a couple of readings. Therefore, if there's any aspect that you feel could be explained more clearly, I am eager to hear your feedback and make the necessary improvements.
If you found this post valuable…
We hope you found value in this article. If you did, we'd appreciate it if you subscribed (at no cost!) to stay updated with our latest publications.


